


一流产品,以专业铸造辉煌

Abstract
The last decade witnessed a tremendous growth in combined efforts of biologists, chemists and physicists to understand the dominant factors determining the specificity and directionality of transmembrane transfer processes in proteins. A large variety of experimental techniques is being used including X-ray and neutron diffraction, but also time-resolved optical, infrared and magnetic resonance spectroscopy. This is done in conjunction with genetic engineering strategies to construct site-specific mutants for controlled modification of the proteins. As a general perception of these efforts, the substantial influence of weak interactions within the protein and its membrane interfaces is recognized. The weak interactions are subject to subtle changes during the reaction cycle owing to the inherent flexibility of the protein-membrane complex. Specific conformational changes accomplish molecular-switch functions for the transfer process to proceed with optimum efficiency. Characteristic examples of time varying non-bonded interactions are specific H-patterns and/or polarity effects of the microenvironment. The present perception has emerged from the coupling of newly developed spectroscopic techniques – and advanced EPR certainly deserves credit in this respect – with newly developed computational strategies to interpret the experimental data in terms of protein structure and dynamics. By now, the partners of this coupling, particularly high-field EPR spectroscopy and DFT-based quantum theory, have reached a level of sophistication that applications to large biocomplexes are within reach. In this review, a few large paradigm biosystems are surveyed which were explored lately in our laboratory. Taking advantage of the improved spectral and temporal resolution of high-frequency/high-field EPR at 95 GHz/3.4 T and 360 GHz/12.9 T, as compared to conventional X-band EPR (9.5 GHz/0.34 T), three biosystems are characterized with respect to structure and dynamics: (1) Light-induced electron-transfer intermediates in wild-type and mutant reaction-centre proteins from the photosynthetic bacterium Rhodobacter sphaeroides, (2) light-driven proton-transfer intermediates of site-specifically nitroxide spin-labelled mutants of bacteriorhodopsin proteins from Halobacterium salinarium, (3) refolding intermediates of site-specifically nitroxide spin-labelled mutants of the channel-forming protein domain of Colicin A bacterial toxin produced in Escherichia coli. The detailed information obtained is complementary to that of protein crystallography, solid-state NMR, infrared and optical spectroscopy techniques. A unique strength of high-field EPR is particularly noteworthy: it can provide highly desired detailed information on transient intermediates of proteins in biological action. They can be observed and characterized while staying in their working states on biologically relevant time scales. The review introduces the audience to origins and basic experiments of EPR in relation to NMR, describes the underlying strategies for extending conventional EPR to high-field/high-frequency EPR, and highlights those details of molecular information that are obtained from high-field EPR in conjunction with genetic engineering and that are not accessible by “classical” spectroscopy. The importance of quantum-chemical interpretation of the experimental data by DFT and advanced semiempirical molecular-orbital theory is emphasized. A short description of the laboratory-built 95 GHz and 360 GHz EPR/ENDOR spectrometers at FU Berlin is also presented. The review concludes with an outlook to future opportunities and challenges of advanced bio-EPR in interdisciplinary research.
1. Introduction
1.1 NMR versus EPR
Imagine opinion polls had been taken every ten years since 1980 and questionnaires had been distributed among scientists from physics, chemistry and biology asking for an answer to the question “what is magnetic resonance?” Up to 10 years ago, most of these scientists, no matter in which specific discipline they had been working, would have responded in detail, but probably with reference to NMR (nuclear magnetic resonance) only. The question “what is EPR?” (electron paramagnetic resonance), however, being specifically asked next in the questionnaire, would probably have been left unanswered by most biologists, and many chemists and physicists would have known only the basic principles of conventional continuous wave X-band EPR spectroscopy (operating at a microwave frequency of around 9 GHz). In fact, in contrast to EPR, NMR has been established over the last 20 years as a multi-frequency tool of highest significance in multi-disciplinary material and life sciences for spectacular applications in structure determination and imaging. Not surprisingly, therefore, as many as four Nobel prizes for NMR methodology and applications have been awarded within the last 13 years (to R. R. Ernst in Chemistry in 1991, K. Wüthrich in Chemistry in 2002, to P. C. Lauterbur and P. Mansfield in Physiology and Medicine in 2003). EPR, on the other hand, seemed to be hopelessly lagging behind its famous (and younger) sister NMR, and it is only during the last decade that the chemistry, biology and physics communities witness a dramatic catching up of EPR because of technological breakthroughs in pulsed microwave, sweepable cryomagnet and fast data acquisition instrumentation. In fact, modern EPR is booming now rather similar to what had happened with NMR 10 years earlier. Hence, imagine there will be another opinion poll these days and again the question will be asked “what is magnetic resonance?” It might turn out that many chemists, biologists and physicists will answer by mentioning both NMR and EPR, both exhibiting unique potentials in elucidating structure and dynamics of complex systems.
Both EPR and NMR were invented by continuous wave (cw) experiments, EPR in 1944 by E. K. Zavoisky at Kazan University in the USSR,1,2 NMR in 1946 by E. M. Purcell, H. G. Torrey and R. V. Pound at Harvard3 and, independently, by F. Bloch, W. Hansen and M. E. Packard at Stanford.4 These classical NMR experiments were honoured as early as 1952 by the Nobel Prize in Physics to Bloch and Purcell. Zavoisky’s discovery of EPR, on the other hand, was only inadequately recognized on the western side of the Iron Curtain (in contrast to the eastern side5), and it was as late as 1977 when Zavoisky was finally honoured at least by the prestigious ISMAR Award of the International Society of Magnetic Resonance at its 6th ISMAR symposium in Banff, Alberta, Canada—posthumously, as he had died in October 1976 just after having been informed in Moscow about the decision of the Prize Committee.
Up to the 60’s, both NMR and EPR remained to be cw methods, i.e., the samples sitting in a static magnetic field were irradiated by continuous radiofrequency (rf) and microwave (mw) electromagnetic fields to drive NMR and EPR transitions, respectively. But it was as early as 1949 when E. L. Hahn6,7 at Urbana applied rf pulses and invented nuclear spin-echo detection, thereby opening the arena for pulse NMR with all its future potential for beautiful multi-dimensional spectroscopy of complex biosystems in the liquid and solid state.8,9 The realization of such pulsed multi-dimensional NMR experiments, however, with their sophisticated pulse sequences and appealing acronyms like COSY, TROSY, NOESY or ROESY, EXSY and SECSY, INEPT and INADEQUATE, had to wait for the introduction of powerful computer and fast Fourier transformation techniques in the late 70’s, before the primary time-domain data could be recorded and translated into spectral information on structure. Nowadays, pulse NMR has completely replaced cw NMR, and high-field cryomagnets and resonance frequencies close to 1 GHz for protons have dramatically improved the detection sensitivity and chemical-shift separations, and even formerly exotic nuclei have become routinely observable.
Despite the breakthroughs in mm and sub-mm microwave technologies in the last decade, in EPR the cw versus pulse situation is very different from that in NMR. The prognosis is that a peaceful coexistence between cw and pulse EPR will continue to persist and will be determined entirely by the characteristics of the sample under study, i.e., the sample properties and relaxation times ultimately dictate the preference for either a cw or pulse experiment to be performed.
Why is there such a discrepancy between the requirements for pulsed NMR and pulsed EPR? The answer is related to the different time scales of the NMR and EPR experiments. They are determined by the nuclear and electron resonance frequencies (in the rf and mw domains, respectively), the characteristic frequency separations in the respective spectra (Hz versus MHz) and the relaxation times T1, T2 (ms versus μs). Because of the long nuclear T1 and T2 times in diamagnetic molecules, NMR pulses need not be shorter than 1 μs, which to coherently generate and detect does not pose technical problems. The electronic relaxation times are typically in the μs range or shorter (T2) and, consequently, in EPR the mw pulses have to be as short as a few ns. To generate them poses great technical problems even today in terms of mw sources and fast computers, as it does to detect and handle the transient signals in the ns time scale. Thus, the instrumental requirements for Fourier-transform (FT) EPR are much tougher to fulfil than for FT-NMR, and this explains why pulse EPR has become popular only since the late 80’s. Pulse EPR spectroscopy has many fathers, and a rich variety of pulse sequences and sophisticated experiments is found in recent reviews and text books (see, for example, ref. 10). It is probably fair to say that truly pioneering work in pulse EPR was done among others by W. B. Mims at Bell Telephone Laboratories,11,12 Yu. D. Tsvetkov in Novosibirsk,13 J. H. Freed at Cornell14 and A. Schweiger at ETH Zurich.10 This work represents a milestone in modern EPR spectroscopy.
1.2 From EPR basics to high-field EPR and ENDOR
Let us take a sample containing molecular radicals with unpaired electron spins with S = 1/2 and place it into an EPR spectrometer. The electron and nuclear spins will align with respect to the total magnetic field composed of the external “Zeeman” field, B0, the local field originating from “spin–orbit coupling” in the radical (leading to effective g-tensor components shifted from the free-electron value) and local “hyperfine” fields from nearby magnetic nuclei, for example protons with nuclear spin I = 1/2. For this sample, the static spin Hamiltonian, Ĥ0, that describes the time-independent spin-interaction energies, consists of three terms
i.e., the field-dependent electron and nuclear Zeeman interactions and the field-independent electron-nuclear hyperfine interactions (h: Planck constant; μB, μK: Bohr and nuclear magnetons; gn: nuclear g-factors; Ŝ, Î: electron and nuclear spin vector operators; the summation is over all nuclei).
(1)
The interaction tensors ![[g with combining tilde]](https://www.rsc.org/images/entities/i_char_0067_0303.gif) and Ãi are probing the electronic structure (wave function) of the molecule either globally ( tensor) or locally (hyperfine tensors). The tensors contain isotropic and anisotropic contributions. In isotropic fluid solution, only the scalar values, Tr()/3 and Tr(Ã)/3, are observed. In frozen solutions, powders or single crystals, on the other hand, also anisotropic tensor contributions become observable provided appropriate resolution conditions prevail. For this situation, the information content of the EPR spectra is considerably enhanced, for example in terms of molecular orientation with respect to B0.
and Ãi are probing the electronic structure (wave function) of the molecule either globally ( tensor) or locally (hyperfine tensors). The tensors contain isotropic and anisotropic contributions. In isotropic fluid solution, only the scalar values, Tr()/3 and Tr(Ã)/3, are observed. In frozen solutions, powders or single crystals, on the other hand, also anisotropic tensor contributions become observable provided appropriate resolution conditions prevail. For this situation, the information content of the EPR spectra is considerably enhanced, for example in terms of molecular orientation with respect to B0.
In the strong-field approximation, the energy eigenvalues of eqn. (1) are classified by the magnetic spin quantum numbers, mS and mI, and are given, to first order, by
 | (2) |
where the scalar quantities g′ and A′ contain the desired information about magnitude and orientation of the interaction tensors.
As an example, let us consider the simple case of a doublet radical (S = 1/2) in isotropic fluid solution containing four symmetry-equivalent protons in a strong B0 field. Fig. 1 shows the energy level scheme according to eqn. (2), in which for isotropic solutions only scalar interaction parameters are observable due to fast molecular tumbling. Following the EPR selection rules ΔmS = ±1, ΔmIi = 0, five EPR lines are observed with binominal intensity distribution owing to the first-order transition-frequency degeneracies of equivalent nuclei.
 | ||
| Fig. 1 High-field spin energy levels of a radical (S = 1/2) with a group of four equivalent protons (I = 1/2) dissolved in fluid solution. MI = ∑imIi is the total nuclear quantum number of the group. The allowed EPR and ENDOR transitions are marked by arrows. | ||
For single-crystal samples, the complete tensor information can be extracted from the angular dependence of the resonance lines when the crystal is rotated in its three symmetry planes (“rotation patterns”). If the and Ãi tensors are collinear, i.e., have the same principal axis system (α,β,γ), their rotation patterns will have the same angular dependence. When the crystal is mounted in such a way that the rotation axis is the x-axis of the molecular axes system (x,y,z) and is perpendicular to the B0 direction, the rotation occurs in the yz plane defining an angle θ between the z-axis and the field direction. Then, g′ takes the form:
| g′ = (g2yysin2θ + g2zzcos2θ + g2yzsin 2θ)1/2 | (3) |
(notice that gij2 denotes the components of the squared tensor). An analogue expression holds for A′i in the limit of small g-anisotropy, as is typical for bioorganic systems as long as they do not contain paramagnetic transition-metal ions. For the other two symmetry planes, zx and xy, the corresponding tensor components are found by cyclic replacement y → z → x → y.
For large low-symmetry radicals, such as those occurring in photosynthesis, with each set of inequivalent nuclei the number of EPR lines obviously increases in a multiplicative way, according to the selection rules ΔmS = ±1, ΔmIi = 0. This results in strongly inhomogeneously broadened EPR spectra because individual hyperfine lines can no longer be resolved in the available spectral range (which is fixed due to the normalization condition for the unpaired electron spin density). For such cases, one can resort to electron–nuclear-double resonance (ENDOR) techniques.10,15,16 It was as early as 1956 when G. Feher17 at Bell Labs, demonstrated that by ENDOR the spectral resolution can be greatly improved. This first ENDOR experiment was technically feasible only because the sample, phosphorus-doped silicon, was studied at low temperature, where all the relaxation times are sufficiently long to easily obtain the necessary saturation of the EPR and NMR transitions. For the radicals in liquid solution, however, these relaxation times are much shorter, on the order of 10−5–10−7 s, and consequently ENDOR-in-solution experiments are technically much more sophisticated, since much larger saturating mw and rf fields have to be applied. This is the reason why the first ENDOR-in-solution experiments required many more years before they were successful. The pioneering work was performed by A. L. Cederquist18 in 1963, who studied metal–ammonia solutions, and by J. S. Hyde and A. H. Maki19 in 1964, who investigated an organic radical in solution. The further development of ENDOR-in-solution spectroscopy was highly stimulated by J. H. Freed,20 whose general theory of saturation and double-resonance proved to be adequate for describing amplitude, width and shape of ENDOR lines in great detail. Certain drawbacks of ENDOR concerning sensitivity and relative line intensities can be overcome by extending it to electron-nuclear-nuclear triple resonance.21 This was proposed by G. Feher22 and J. H. Freed,23 but experimentally realized for a radical in solution first in the Möbius group at FU Berlin by K. P. Dinse et al.24 (“Special TRIPLE”). As was demonstrated in the same group by R. Biehl et al.,25 additional information about relative signs of hyperfine couplings of radicals in solution can be obtained by generalizing the triple resonance experiment to include NMR transitions of different nuclei in the radical (“General TRIPLE”). The analogue of this experiment for solid-state samples at low temperature was performed earlier by R. J. Cook and D. H. Whiffen.26 The advantages of TRIPLE over ENDOR, enhanced sensitivity and resolution, information about multiplicity and relative signs of hyperfine couplings from line intensity variations, often justify the extra experimental efforts inherent in the triple resonance spectroscopy.21
In ENDOR, the sample is irradiated simultaneously by two electromagnetic fields, a mw field (to drive EPR transitions ΔmS = ±1) and an rf field (to drive NMR transitions ΔmIi = ±1). Under appropriate experimental conditions, which are different for cw and pulse irradiation schemes.10,15,27 ENDOR signals are observed by monitoring the changes of EPR line amplitudes when sweeping the rf field through the nuclear resonance frequencies. Thus, every group of equivalent nuclei, no matter how many nuclei are involved and what their spin is, contributes only two ENDOR lines because, within an mS manifold, the hyperfine levels are equidistant to first order. The gain in resolution of ENDOR versus EPR, therefore, becomes very drastic for low-symmetry molecules because, with increasing number of groups of nuclei, the number of ENDOR lines increases only in an additive way. This gain in resolution is particularly pronounced when nuclei with different magnetic moments are involved. Their ENDOR lines appear in different frequency ranges, and from their Larmor frequencies these nuclei can be immediately identified. In the case of accidental overlap of ENDOR lines from different nuclei at X-band (9.5 GHz, 0.34 T) they can be separated when working at higher mw frequencies and Zeeman fields, for instance at 95 GHz, 3.4 T (W-band) or even at 360 GHz, 12.9 T (see Fig. 2).
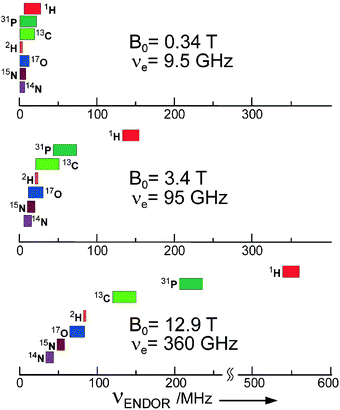 | ||
| Fig. 2 Gain in ENDOR resolution for doublet state systems (S = 1/2, g = 2) with increasing microwave frequency and Zeeman field. Spectral lines of different nuclei in organic biomolecules, largely overlapping at the traditional frequency of 9.5 GHz (X-band), become completely separated at 360 GHz. | ||
For a doublet radical, the ENDOR lines of a particular group of equivalent nuclei appear, to first order, at
 | (4) |
with the free nuclear Larmor frequency νn = (gnμK/h)B0, and A′ being defined analogous to eqn. (3). In isotropic solution, the hyperfine couplings (hfc’s) are given by A′ = Tr(Ã)/3. Hence, in essence, ENDOR is a variant of NMR on paramagnetic systems, the unpaired electron serving as highly sensitive detector for the NMR transitions. Double resonance excitation thus offers the advantage of detecting low-intensity rf transitions by high-intensity mw transitions, i.e., by means of quantum transformation.
To illustrate the power of the ENDOR method, monomeric BChl a˙+ is chosen as example28–30 (Fig. 3). The low-symmetry BChl a˙+ is involved as an electron-transfer partner in bacterial photosynthetic reaction centres (RCs) from Rb. sphaeroides (see below). It contains many inequivalent sets of protons and nitrogens and, consequently, the EPR spectrum, even in liquid solution at room temperature, is strongly inhomogeneously broadened with only an indication of hyperfine-structure resolution (see Fig. 3A). This gets even worse for a dimer of bacteriochlorophylls like P865˙+, the primary-donor cation in RC protein complexes, for which only a Gaussian envelope EPR line can be observed, with no indication of hyperfine structure at all. ENDOR-in-solution and TRIPLE21 at elevated temperatures are superior to EPR in this respect because the linewidths are smaller, owing to the motional averaging of anisotropic hyperfine interactions in fluids, so that several isotropic hfc’s from the magnetic nuclei in the radicals can be obtained (see Fig. 3B). For BChl a˙+ up to 12 proton hfc’s could be determined and assigned to molecular positions.31,32 Furthermore, all four nitrogen hfc’s could be obtained by ENDOR in 15N-labeled BChl a˙+,32–34 whereas in the 14N-containing species only up to three 14N hfc’s were resolved.31 First liquid-state ENDOR and TRIPLE experiments on P865˙+ in RCs from Rb. sphaeroides under physiological conditions (water, 25 °C), carried out in this laboratory35,36 showed that the overall rotation of the RC protein is fast enough in this environment to effectively average out the hyperfine anisotropy of the various nuclei in the radical. Consequently, a highly resolved ENDOR spectrum was obtained, and at least seven proton hfc’s could be extracted (see Fig. 3C). By comparing the hfc’s of monomeric BChl a˙+ and light-induced P865˙+, the “special pair” hypothesis of Norris et al.37 and Feher et al.38 could convincingly be confirmed, which had been deduced from solid-state EPR and ENDOR experiments.
 | ||
| Fig. 3 X-band EPR (A) and proton “special TRIPLE” resonance spectra of liquid-solution samples of BChl a˙+ (iodine oxidation) at 255 K (B) and P865˙+ of Rb. sphaeroides (light illumination) at 293 K (C). (The rf-frequency offset indicates the hyperfine shifts with respect to the free-proton Larmor frequency, νp, which is scaled to zero.) The assignment of lines refers to the structural formula of bacteriochlorophyll a; all assigned hfc’s have positive signs (obtained from “general TRIPLE”) as is typical for β protons. For details, see refs. 33 and 35. | ||
Well below room temperature, the overall rotation of the protein complex becomes so slow that powder-type spectra are obtained. Nevertheless, under certain circumstances which depend on the magnitude of the anisotropy of the interactions in the spin Hamiltonian in comparison to the inhomogeneous line width, even from disordered powder-type EPR spectra single-crystal like information can be extracted by applying orientation-selective ENDOR.39–42 In the case of transition-metal complexes the hyperfine anisotropy may provide this orientation selectivity from the entire orientational distribution of the molecules. In the case of organic radicals with small hyperfine interactions one has to resort to the anisotropy of the Zeeman interaction which can become large enough at high B0 fields to provide the desired orientation selectivity for ENDOR experiments42 (see below). The best approach for elucidating molecular structure and orientation in detail is, of course, to study single-crystal samples. Unfortunately, to prepare them is often difficult or even impossible for large biological complexes.
2. Why high-field EPR and ENDOR?
We now turn to high-field/high-frequency EPR and ENDOR experiments in more detail to show what can be additionally learned about biological systems when going beyond conventional X-band EPR/ENDOR. From the spin Hamiltonian (eqn. (1)) one sees that some interactions are magnetic field-dependent (the Zeeman interactions), while others are not (the hyperfine interactions). Obviously, in complex biological systems it will be necessary to measure at various field/frequency settings in order to separate these interactions from each other. Up to now, continuous-wave (cw) and time-resolved (tr) EPR studies on biological samples have been concentrated on standard X-band frequencies (9.5 GHz), extensions to lower (S-band, GHz) and higher microwave frequencies (K-band, 24 GHz; Q-band, 35 GHz; W-band, 95 GHz, or even higher frequencies) are exceptions.
For low-symmetry systems, particularly in frozen solution samples, standard EPR suffers from low spectral resolution due to strong inhomogeneous line broadening. Such problems arise, for instance, because several radical species or different magnetic sites of rather similar g-values are present or a small g-tensor anisotropy of the paramagnetic system does not allow canonical orientations of the powder EPR spectrum be observed. In such a case, even X-band ENDOR may not be sufficiently orientation-selective to provide single-crystal type information of the hyperfine structure. For improving the spectral resolution by high-field EPR, we have to define a lower limit of the mw frequency and corresponding magnetic field B0. For “true” high-field EPR experiments, properties of the spectrometer have to be related with properties of the sample: For all cases of delocalized spin systems, in which unresolved hyperfine interactions dominate the inhomogeneous EPR linewidth, a true high-field experiment must fulfil the condition
 | (5) |
i.e., the anisotropic electron Zeeman interaction must exceed the inhomogeneous line broadening, ΔBhf1/2. For example, for deuterated samples, Q-band EPR might already fulfil this condition in the case of semiquinone radicals with rather large g-anisotropy, whereas for protonated samples with inherently larger linewidths, it does not. On the other hand, in the case of chlorophyll ion radicals, due to their small g-anisotropy, even W-band EPR might not meet the high-field condition for protonated samples. Then deuteration of the sample will be necessary or, as an alternative, to further increase the mw frequency and B0 field, for instance by resorting to 360 GHz EPR (see below). Except for transition-metal complexes, most bioorganic systems have g = 2, and relative g variations and anisotropies, Δg/g, rarely exceed 10−4–10−3. At X-band frequencies the corresponding ΔB0 values are only 0.03–0.3 mT, which can easily be masked in disordered samples with typical EPR linewidths around 1 mT. Fortunately, for many non-metallic protein systems the increase of ΔB0 with increasing Zeeman field directly translates into an increase of spectral resolution, because often no noticeable line broadening occurs with increasing B0. For the primary donor cation radical in RCs from Rb. sphaeroides, for example, up to 24 T were applied,43 and g-strain broadening was found to be negligible. Double-resonance extension to high-field ENDOR then has the additional advantage of providing single-crystal-like hyperfine information in the reference frame of the g-tensor, even from disordered samples with very small g-anisotropy. Fig. 4 shows, as an example, the Zeeman magnetoselection of W-band EPR and ENDOR on the radical anion of ubiquinone-10 in frozen perdeuterated propan-2-ol at T = 115 K.42 Pronounced orientational selectivity of the g-tensor components is achieved by W-band EPR which is inaccessible by X-band EPR (compare Fig. 4A and 4B). This is further exploited by performing W-band pulsed Davies-type ENDOR at the well-separated B0 values corresponding to the canonical g-tensor peaks to obtain dominant proton hfc’s (for the Davies-ENDOR pulse sequence, see Fig. 6 later). At least for the gxx and gzz canonical field positions, the ENDOR spectra are single-crystal-like with narrow lines. Accordingly, the representations of the orientational selections of molecules show narrow distributions (see right side of Fig. 4C). These representations follow from the simulations of the spectra on the basis of the spin Hamiltonian of eqn. (1). The orientational distribution of molecules is considerably broader for the gyy value, which reflects its still insufficient resolution by W-band EPR. When varying the solvent (protic and aprotic, with and without perdeuteration), characteristic changes of hyperfine- (predominantly along the y-direction) and g-tensor components (predominantly along the x-direction) could be discerned. They are attributed to hydrogen-bond formation at the lone-pair orbitals of the oxygens.42
 | ||
| Fig. 4 (A) X-band cw-detected and (B) W-band ESE-detected EPR spectra of anion radicals in frozen perdeuterated propan-2-ol solution (T = 115 K). (C) Davies-ENDOR spectra taken at the three B0 positions marked in (B) that represent canonical g-tensor orientations. Dotted lines show the simulated ENDOR spectra from which the degree of orientation selection of contributing molecules (right) was derived.42 On top the chemical structure of ubiquinone-10 is given together with the coordinate system fixed to the quinone-ring plane. | ||
Also for high-spin systems (S > 1/2) such as enzymatic proteins with several transition metal cofactors, high-field EPR might be of advantage. An example is the nitrogenase MoFe protein that is spin-coupled to S = 3/2.44,45 For such systems a “fine-structure” term Ĥss has to be added to the spin Hamiltonian, i.e., eqn. (1) has to be extended by
Ĥss/h = Ŝ·![[D with combining circumflex]](https://www.rsc.org/images/entities/i_char_0044_0302.gif) ·Ŝ − JŜ1·Ŝ2 ·Ŝ − JŜ1·Ŝ2 | (6) |
with the total spin S1 + S2 = S to consider the interactions between a pair of paramagnetic ions with spins S1 and S2 coupling to the total spin S. Here ![[D with combining tilde]](https://www.rsc.org/images/entities/i_char_0044_0303.gif) is the traceless zero-field splitting tensor, and J is the isotropic exchange interaction parameter (in standard convention J < 0 corresponds to antiferromagnetic coupling, J > 0 to ferromagnetic coupling). In the principal axis system of , the anisotropic part in eqn. (6) is normally rewritten in terms of the zero-field parameters D, E:
is the traceless zero-field splitting tensor, and J is the isotropic exchange interaction parameter (in standard convention J < 0 corresponds to antiferromagnetic coupling, J > 0 to ferromagnetic coupling). In the principal axis system of , the anisotropic part in eqn. (6) is normally rewritten in terms of the zero-field parameters D, E:
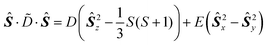 | (7) |
with D = (X + Y)/2 − Z, E = −(X − Y)/2, where −X, −Y, −Z are the zero-field energy values.
Although in the spin Hamiltonian the fine-structure term is not field dependent it leads, in combination with the electron Zeeman term, to field-dependent mixing of the electron spin eigenfunctions. When the external field values B0 lead to electron Zeeman splittings comparable in magnitude to the fine-structure splittings, the mixing gets very severe. This intermediate region requires elaborate calculations to analyse the EPR spectrum. Hence, one more reason to perform high-field EPR is to simplify the spectrum analysis for high-spin systems.
Moreover, it might happen that EPR transitions of high-spin systems with large zero-field splittings cannot be observed at all at X-band frequencies because the energy of the mw quantum is too small. For such cases the higher quantum energy of high-frequency microwaves can drive the transitions. An example for such a biological high-spin system is metmyoglobin with S = 5/2 ferric heme, for which EPR transitions at 130 GHz became observable that were undetectable at X-band due to the large zero-field splitting.46 Another benefit is that the EPR lines of high-spin systems usually get narrower at higher magnetic fields than in X-band EPR because of second-order effects: If we take Mn2+ centres (S = 5/2, I = 5/2) in disordered protein samples as an example, the EPR transitions are strongly broadened by contributions from the zero-field tensor. Their linewidth, ΔB1/2, is determined by second-order contributions from the zero-field coupling D, ΔB1/2 ∝ D2/B0, and “needle sharp” manganese hyperfine lines are observed in 95 GHz high-field EPR spectra of Mn2+ protein complexes even in disordered samples. A challenge for future high-field EPR experiments is the water-splitting manganese complex in photosystem II of green plants. Structure and enzymatic function of the Mn cluster site in PS II are still subject of controversial discussions, and additional information from high-field EPR is desirable. Up to now, however, no high-field EPR signals from the PS II Mn cluster have been reported, but promising multi-frequency high-field EPR experiments on relevant binuclear Mn(III)Mn(IV) mixed valence complexes have already been performed.47,48 The line-narrowing behaviour is often exploited in high-field EPR by using Mn2+ ions doped into MgO powder as reference sample for precise g-factor and field-calibration measurements.49
With these advantages in mind, over the last 20 years a small number of dedicated laboratories met the technological challenge to construct mm and sub-mm high-field EPR and ENDOR spectrometers, thereby opening a promising new research area. The physical principles and technical aspects have been published by the laboratories involved. The pioneering high-field EPR work was done by Ya. S. Lebedev in Moscow.50 Appropriate references to these laboratories are included in recent overview articles, for instance.14,51–61 Some details of the laboratory-built 95 GHz and 360 GHz EPR/ENDOR spectrometers at FU Berlin are presented below (see also refs. 49, 62–64).
3. High-field EPR and ENDOR spectrometers developed at FU Berlin
3.1 The 95 GHz spectrometer
The development of a W-band (95 GHz) EPR spectrometer at FU Berlin started at the beginning of the 80’s with the aim to construct a multi-purpose high-sensitivity machine. The continuous improvement of the first spectrometer version65 went in parallel with the improvements of commercial superconducting magnets, mm microwave components, control instrumentation as well as computer technology in the last 20 years.49,58,62
Increasing the mw frequency for mm high-field EPR causes two main technical problems: First, the required magnetic field strength increases proportionally to the frequency increase and, at 95 GHz, reaches, for molecules with g = 2, a value of 3.4 T. This field strength cannot be generated any more by resistive electromagnets, but requires superconducting cryomagnets. Second, at 95 GHz and higher frequencies, the performance of the mw components deteriorates, especially of mw sources and amplifiers. Additionally, higher precision is required for manufacturing the mechanical parts, such as waveguides and resonator probeheads due to the decreasing wavelength.
In our 95 GHz spectrometer a superconducting magnet (Cryomagnetics, USA) provides a B0 field of up to 6 T at a warm-bore diameter of 114 mm, see Fig. 5. The field homogeneity of 1 ppm (about 3 μT at 3.4 T) over a spherical volume of 10 mm diameter is sufficient for EPR applications because of the intrinsic EPR linewidth (typically 0.1 mT or larger for solid-state samples at such high magnetic fields) and the small sample size (typically smaller than the mw wavelength of 3 mm). The magnetic field can be linearly swept up to ±0.1 T by controlling the current in additional superconducting sweep coils inside the magnet Dewar.
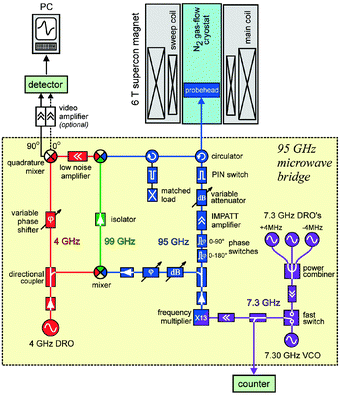 | ||
| Fig. 5 Block diagram of the present upgraded version of the laboratory-built 95 GHz high-field EPR spectrometer at FU Berlin. For details, see text. | ||
In the early days of high-field EPR development the challenging task was to fight the low performance of mw components in the mm and sub-mm regions. This situation has recently improved by novel developments in mm-wave radar and radio-astronomy projects, and high-performance mw components are becoming commercially available.57,58,63,66 Nowadays, W-band EPR spectroscopy has been established as a powerful technique which can favourably compete with conventional X-band EPR in terms of detection sensitivity, reaches comparable pulse-scheme versatility, and is clearly superior in spectral and time resolution.
Fig. 5 shows the detailed block diagram of the last upgrade of the EPR microwave bridge developed at FU Berlin. The heterodyne detection bridge works at an intermediate frequency (IF) of 4 GHz. It is provided from the dielectric-resonator oscillator (DRO) which allows convenient manipulation of phase and amplification. The signal-oscillator output power at 95 GHz is used to irradiate the sample and, when the EPR resonance condition is met, the reflected power from the resonator is mixed with the 99 GHz local-oscillator signal. This is obtained by up-conversion of the 95 GHz signal-oscillator power with the 4 GHz DRO. Down-conversion to 4 GHz IF is achieved by mixing the 95- and 99 GHz microwaves. This 4 GHz power is amplified with a low-noise preamplifier and then down-mixed with the same 4 GHz DRO as local oscillator. The resulting quadrature signal is guided either to a lock-in amplifier or, after optional further amplification, to a fast digitizing scope. The newest developments in semiconductor microwave technology allowed us to replace the klystron, which was used many years as an optimum 95 GHz source,49,62 by a specially designed solid-state oscillator source. It utilizes four low-frequency oscillators, three fixed-frequency, temperature-stabilized DROs and one voltage-controlled oscillator (VCO), operating at 7.3 GHz. The frequency of this mw field is up-converted by a factor of 13 using an IMPATT-active frequency multiplier. An additional gain of the 95 GHz power could be obtained by a two-stage cw IMPATT amplifier in the transmitter channel.
Fig. 6 shows selected irradiation schemes of the various cw and time-resolved EPR and ENDOR experiments on laser-pulse initiated transient intermediates that can currently be performed with our W-band spectrometer. For the experiments several probehead configurations, including multimode Fabry–Perot resonators and single-mode TE011 cylindrical cavities (see Fig. 7), have been designed and optimized for EPR or ENDOR on a variety of different samples, e.g., lossy aqueous or non-lossy frozen-solution samples.49,62,67–69 In cw EPR experiments, a 10 kHz modulation of the magnetic field is achieved by additional coils placed around the EPR cavity. They provide up to 1 mT modulation amplitude at the sample. For both cw and pulsed ENDOR experiments, the TE011 cavity is slotted to reduce eddy currents induced by the rf field of the ENDOR coil placed around the cavity. For proton ENDOR the rf circuit is tuned to and matched for 140 MHz (with 40 MHz bandwidth) corresponding to the proton Larmor frequency at 3.4 T. An rf power of 300 W in cw and 2.5 kW in pulse mode is available. It yields 2 μs long rf π-pulses in proton ENDOR experiments. ENDOR on other nuclei can also be performed by using a short-cut rf circuit optimized for 40 MHz central frequency (with 30 MHz bandwidth).
 | ||
| Fig. 6 Microwave (mw) and radio-frequency (rf) irradiation schemes of various time-resolved EPR techniques. The initial laser excitation pulse hν starts the photoreaction with paramagnetic intermediates. All these experiments are currently performed in the high-field laboratory at FU Berlin. For details of such experiments, see for example refs. 10, 51 and 60. | ||
 | ||
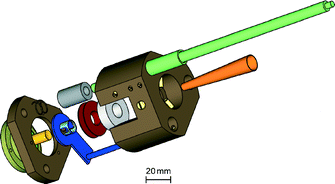
| Fig. 7 Exploded view of the 95 GHz EPR probehead with TE011 cavity. For details, see text. | ||
For light-excitation experiments either the Nd-YAG laser beam (355 nm, 532 nm wavelengths) or the light of a 100 W halogen lamp is guided to the cavity by means of a quartz fibre of 0.8 mm diameter. Temperature control of the sample between 90 and 350 K is achieved by a stabilized nitrogen gas-flow system in the probehead. In addition, a continuous-flow system for liquid solutions to be pumped through the W-band cavity allows to perform photochemical experiments on systems with irreversible sample depletion.70 For single-crystal samples to measure the complete rotation patterns, a W-band Fabry–Perot resonator has been constructed containing a goniometer with three rotation axes.67
For small single-crystal samples in the TE011 cavity, the cw EPR sensitivity is about 108 spins/mT at 1 Hz detection bandwidth, i.e., about two orders of magnitude higher than at standard X-band frequencies.71 This number corresponds to a minimum detectible concentration of a nitroxide spin label in frozen solution of 0.1 μM (200 K, sample tube ID 0.6 mm, active sample volume 1 μl). For direct-detection time-resolved (tr) EPR measurements the time resolution of the heterodyne detection channel of about 2 ns and the short ringing time of the EPR cavity, QL(πν)−1, of about 6 ns (cavity loaded quality factor QL = 2000 at ν = 95 GHz) provide a time resolution one order of magnitude higher than with X-band tr EPR. In contrast to pulsed X-band spectrometers with their high-power TWT mw amplifiers, the mw power required for pulsed W-band experiments is drastically smaller due to the small cavity dimensions. The shortest measured π/2-pulse length of 22 ns is achieved with a 95 GHz power of only 100 mW at the TE011 cavity (QL = 2500). For comparison, to obtain the same pulse length in a standard X-band TE102 cavity with the same QL, about 20 W mw power incident on the cavity is required. Another advantage of a pulsed W-band EPR spectrometer is its short dead time. This time is most relevant for practical applications. It is defined as the time interval from the moment when the mw power is switched on or off to the moment when the EPR signal can be recorded without any distortions. At W-band the dead time is more than an order of magnitude shorter than at X-band. This is due to the much lower mw power required for sample excitation at 95 GHz and the higher ringing frequency (shorter ringing time) of the W-band cavity. For our W-band spectrometer configuration with quadrature detector, the dead time is measured to be 10QL/1000 ns when using the full excitation mw power. The technical specifications of the present version of our TE011-cavity based W-band spectrometer ought to be compared with the most recently published specifications of the new W-band spectrometer at Cornell.66 This high-power pulsed spectrometer is based on a Fabry–Perot resonator probehead and incorporates an “extended interaction klystron” (EIK) as microwave source which is used to amplify the mm-wave pulses to the 1 kW power level.66
3.2 The 360 GHz spectrometer
The 360 GHz EPR spectrometer built at FU Berlin has been previously described in detail.64,72 The most notable difference to an EPR spectrometer operating at lower fields and frequencies, for example at X- or W-band, is the use of quasi-optical mw components of the heterodyne mw bridge and a corrugated waveguide in the transmission line to the probehead. This is indispensable, since the losses in conventional fundamental mode waveguides become prohibitive at mw wavelengths in the sub-mm range, while in a quasi-optical setup the use of free-space Gaussian beam propagation leads to very low losses.
A further advantage of the Gaussian beam optics is that it greatly facilitates an induction-mode design of the mw bridge (see Fig. 8). In an induction-mode detection scheme, the EPR signal is discriminated from the excitation microwave by letting it excite orthogonal degenerate resonator- and transmission-line modes. In our spectrometer, the different modes are provided by the perpendicular polarization of the mw Gaussian beams. They are separated by a wire-grid polarizer yielding an overall isolation of ∼30 dB. Elliptical mirrors with off-axis beam alignment are chosen as focusing elements in favour of lenses because they do not generate standing waves in the system and have lower insertion losses. The excitation mw at ν = 360.03 GHz is generated by a phase-locked tripled 120.01 GHz Gunn source (Farran Technology, Ireland). In the heterodyne detection channel, a sub-harmonic mixer with a doubled 90.31 GHz local oscillator (Farran) down-converts the signal reflected from the probehead to an IF signal of 1.21 GHz with a subsequent power-detection or quadrature-detection stage.
 | ||
| Fig. 8 360 GHz EPR setup. The cw Gunn source (green) can be exchanged for the pulsed Orotron source (green) by replacing the first off-axis elliptical mirror by a Teflon lens. In the beam path in the quasi-optical bridge (orange), beam propagation directions are indicated by dashed arrows (red) and polarization directions by solid arrows (green). Inside the magnet (grey), the corrugated waveguide, the modulation coil and the semiconfocal Fabry–Perot resonator with mesh coupling are indicated. The EPR-induced microwave signal reflected from the polarizer grid is focused onto the horn of the subharmonic mixer detector (blue). Light excitation is introduced into the probehead via a light guide (red). | ||
Inside the magnet warm bore, the limited space prevents the use of reflective focusing optics. Instead, we employ a circular corrugated waveguide. The incoming linearly polarized Gaussian beam couples with high efficiency to the hybrid HE11 mode of the corrugated waveguide which also has linear polarization and a Gaussian intensity profile. Both the quasi-optical components and the corrugated waveguide exhibit low cross-polarization that is essential for the induction-mode scheme. To couple the microwave into the resonator, the corrugated waveguide has a tapered bottom end.
The original brass probehead contains a semi-confocal Fabry–Perot (FP) resonator (see Fig. 9), consisting of a free-standing copper mesh that constitutes the flat mirror, and a spherical gold-coated quartz mirror. The FP resonator operates in a cylindrically symmetric TEM006 mode. It is set up in reflection with the microwaves coupled to the resonator through the mesh, and the sample deposited onto the surface of the spherical mirror. The resonator can be tuned via three straight rods by a micrometer screw on top of the probehead. Light excitation of the sample can be achieved by introducing a quartz light fibre close to the coupling mirror to illuminate the sample through the mesh. A new probehead for low-temperature experiments was constructed recently. The body of the probehead containing the FP resonator is machined from TUFNOL (Tufnol Ltd, UK), a cotton reinforced epoxy laminate with very good machining and thermal properties. It allows quick cooling of the cryostat while avoiding electromagnetic shielding or heating problems typical for metallic probeheads. This is essential for ENDOR experiments. The holders for the coupling mesh and for the modulation and ENDOR coils are fabricated from MACOR (Corning Inc., USA), a machinable glass ceramic. Due to the compact design of the probehead, B0-field modulation amplitudes up to ∼3 mT can be applied without generating excessive microphonics.
 | ||
| Fig. 9 Exploded view of the 360 GHz cw EPR probehead. From left to right: spherical Fabry–Perot resonator-mirror (gold-plated quartz, yellow), springs (phosphorus bronze, black), single-loop ENDOR coil (light blue), ENDOR rf leads and oscillating circuit (blue), tuning rod bushes (bronze, grey), modulation-coil holder (red), coupling mesh (flat Fabry–Perot mirror) holder (white), main body (Tufnol, brown) with taper-centering screws (yellow), corrugated waveguide-taper (orange), tuning rods (copper/epoxy resin glass fabric, green). | ||
The magnet is a superconducting Teslatron-H system (Oxford Instruments, UK) with a B0-field strength of up to 14 T (12.9 T for g = 2 systems), a homogeneity of 3 ppm in a 10 mm sphere and a warm-bore diameter of 88 mm. The integrated superconducting sweep coil provides a sweep range of ±0.1 T with the main coil in persistent mode. The static-flow cryostat (Oxford) of the spectrometer (inside diameter 62 mm) supports temperatures between 4 K and room temperature. Since at B0 = 12.9 T the temperature corresponding to the Zeeman energy is 17.3 K, high Boltzmann polarization is achieved already at higher temperatures compared to low-field EPR. Since the current-field relation of the superconducting sweep coil is non-linear, the Mn2+ ion in a MnO/MgO polycrystalline matrix has been used as field standard for calibration of B0.49,72 The standard is dispersed as a powder into a polystyrene matrix and placed directly adjacent to the sample on the Fabry–Perot mirror to minimize effects of residual field-inhomogeneities and to prevent standard and sample from mixing.
The overall detection sensitivity of the spectrometer has been measured to be 1.5 × 10¹⁰ spins/mT at 1 Hz detection bandwidth by evaluating the signal-to-noise ratio of a known number of spins in a Mn2+ sample. Because of this high detection sensitivity the 360 GHz spectrometer is particularly suited to resolve extremely small g-anisotropies of samples that are available only in minute quantities. Prime examples, site-specific mutants of the chlorophyll cofactor radicals in photosynthetic reaction centres, are presented below.
The basic cw version of the 360 GHz spectrometer has been extended recently for operation both in pulsed EPR and ENDOR modes. For ENDOR measurements, the probehead can be fitted with an additional rf circuit, consisting of a single loop coil around the FP resonator and an rf-oscillator circuit with tuneable capacitors to allow for impedance matching of the ENDOR coil. The new TUFNOL resonator construction has been optimized to reduce heating effects that were disturbing the experiments in our earlier version of the ENDOR setup, with first tests in progress.
For pulsed EPR operation, the multiplied cw Gunn-diode source can be exchanged for a novel pulsed vacuum-tube source, a 360 GHz Orotron (Gycom Ltd, Russia). At its core, the Orotron is a Smith–Purcell non-relativistic free-electron maser embedded in a high-quality Fabry–Perot resonant structure to achieve high output power and frequency stability. The design employed in our novel setup extends previous cw Orotron constructions by introducing a high-voltage gating grid close to the electron-beam generating cathode. This opens the possibility to generate pulsed microwave radiation by selectively blocking the electron beam via pulsed application of high voltage to the gating grid. A detailed description of the operating principle and technical realisation of our pulsed Orotron has been presented in a recent publication.73
4. Computational methods for data interpretation
The development of multifrequency EPR spectroscopy has provided a powerful tool to the exploration of molecular structure and dynamics complementary to other strategies. Despite this development the explorer needs the additional aid of modern quantum chemistry theory. This statement applies also to reliable computational methods to calculate the interaction parameters of the spin Hamiltonian, in particular electron-nuclear hyperfine-, quadrupole- and g-tensor components. It is this combination of new technologies for measuring different molecular parameters and the enormous increase in computing power that now allows biophysicists to describe quantitatively proteins in actions, and to visualize complex biosystems in their three-dimensional structure and functional dynamics. But even today the level of molecular theory chosen remains to be a compromise between reliability of the predictions and affordable computational time, and the compromise is dictated by the size of the molecular system.
In comparison to hyperfine tensors the theory for g-tensor calculations of complex molecular systems was rather neglected for a long time because of missing experimental g-tensor data of sufficient precision. Given the improved spectral resolution and information available from high-field EPR, it has become increasingly desirable now to calculate in particular g-tensors on a thorough quantum-mechanical basis with sufficient accuracy and reliability. This impetus, combined with improvements in quantum-chemical programs and computer hardware, has in the past years tremendously stimulated the development in quantitative calculations of g-tensors.
After earlier INDO or AM1 type semiempirical quantum-chemical approaches to calculate g-tensors of bioorganic systems,74–76 our laboratory has recently joined the few existing groups in the high-field EPR community that apply modern and quite pretentious density functional theory (DFT) methods to g-tensor calculations. One of the two first modern DFT approaches to the calculation of magnetic resonance parameters has been reported by van Lenthe and coworkers77 and is implemented in the widely used Amsterdam Density Function (ADF) code.78 A serious limitation of this “zero order regular approximation” (ZORA) is the use of a spin-restricted treatment which is inappropriate for the calculation of nuclear hfc’s, the evaluation of which along with the g-tensor is at least equally important.
An alternative modern DFT approach which allows the calculation of hfc’s and g-tensors at the same spin-unrestricted levels, has been developed by Schreckenbach and Ziegler.79 Two related implementations have been reported by Kaupp and coworkers80 and by Neese.81 These three approaches do all employ second-order perturbation theory based on the unrestricted Kohn–Sham equations.82 They incorporate relativistic contributions to the g-tensor at different levels of approximation. The SZ-method79 has the distinct advantage of using gauge including atomic orbitals (GIAOs) or “London orbitals”.83 These orbitals avoid the undesirable gauge dependence (choice of origin) in the calculation of g-tensors introduced by the orbital Zeeman operator.
In our recent study of g shifts in the primary donor P˙+ in Rb. sphaeroides mutants (see below), we used the SZ-method at the “relativistic scalar Pauli” level employing double-zeta atomic basis sets and the Becke exchange84 and Lee–Yang–Parr correlation85 options for the generalized gradient approximation (GGA) part of the exchange–correlation (XC) functional.79 Appropriate computer programs with extensive documentation are commercially available as part of the ADF program package.78
As a general statement one can say that the theory of g-tensor calculations is much more involved for organic systems with many carbon atoms and strongly delocalized electrons than for systems with dominant heavy-atom contributions, such as metallo-proteins, quinones or nitroxides.86–88 Therefore, in this review we will refrain from describing in length the details of g-tensor theory for strongly delocalized systems, like the dimeric chlorophyll donor in photosynthetic systems, and rather present only the results of our computation. On nitroxide-labelled proteins, on the other hand, with strong localization of the unpaired electron on the N and O atoms, we will sketch some more details of the theory behind the computations (see below).
5. Characterization of molecular switches in paradigmatic proteins
In this overview we focus on a selection of protein systems that were previously crystallized and for which high-resolution X-ray structures have been made available by now: bacterial photosynthetic reaction centres (RCs) for light-induced electron transfer across the membrane; bacteriorhodopsin (BR), the light-driven transmembrane proton pump; colicin A, the transmembrane ion-channel forming bacterial toxin. These proteins have been characterized in detail over the last years by powerful spectroscopic techniques including, for example, ultra-fast laser spectroscopy,89 FT-IR,90–93 solid-state NMR94–96 and multifrequency EPR.53,56,97–99 In addition, sophisticated theoretical studies had been performed to elucidate their light-induced electron and proton transfer characteristics. Hence, these proteins represent paradigm systems of general interest. They are well suited for new multifrequency high-field EPR experiments to study functionally important transient states during biological action. Furthermore, we prefer EPR as the method of choice because of the accessibility of functionally important time windows for the transient states. These states are either directly detectable by EPR by their transient paramagnetism as, for instance, the radical-ion and radical-pair states of cofactors involved in photosynthetic electron transfer in RCs or, more indirectly, by site-specific nitroxide spin-labelling of the protein as, for instance, in site-directed mutants of BR and Colicin A. It will be shown that high-field EPR experiments allow specific protein regions to be identified and characterized as molecular switches for vectorial transfer processes across membranes. Such switches are envisaged to function by controlling the electronic structure of cofactors, for example by invoking weak cofactor-protein interactions via H-bonds, by polarity gradients or even by substantial cofactor and/or helix displacements. RCs and BR are examples of involving molecular switches of this kind to control their vectorial transmembrane electron and proton transport. Colicin A toxin, on the other hand, requires massive protein refolding for transmembrane channel formation with subsequent ion depletion and cell death.
The high-field EPR work on the RC, BR and Colicin A paradigm proteins presented in this overwiew was performed in collaboration with the research groups of W. Lubitz (Mülheim/Ruhr) for the RC studies and of H.-J. Steinhoff (Osnabrück) for the BR and Colicin A studies.
5.1 Bacterial photosynthetic reaction centres (RCs) of Rb. sphaeroides
Photosynthesis is the most important process that enables life on Earth by converting the energy of sunlight into electrochemical energy needed by higher organisms for synthesis, growth and replication. The so-called primary processes of photosynthesis are those in which the incoming light quanta, after being harvested by “antenna” pigment/protein complexes and channelled to the RC complexes by ultra-fast energy transfer, initiate electron-transfer (ET) reactions between protein-bound donor and acceptor pigments across the cytoplasmic membrane. The successive charge-separating ET steps between the various redox partners in the transmembrane RC have very different reaction rates, kET. The lifetimes, t1/2 = (kET)−1, of the transient charge-separated states range from less than 1 ps for neighbouring donor–acceptor pigments to more than 1 ms for large donor–acceptor separations on opposite sides of the membrane (ca. 40 Å). The cascade of charge-separating ET steps of primary photosynthesis competes extremely favourably with wasteful charge-recombination ET steps thereby providing almost 100% quantum yield. The largest impact of photosynthesis on life on Earth is due to green plants and certain algae in whose RCs a reversible catalytic ET photocycle occurs for which water serves as electron donor. Carbon dioxide is fixed in the form of carbohydrates, and oxygen gas is released as a by-product thereby stabilizing the composition of the Earth’s atmosphere.
Three billion years before green plants evolved, the Earth and its atmosphere were very different from what they are today. Nevertheless, photosynthetic energy conversion could be achieved by certain bacteria, for instance the purple bacterium Rhodobacter (Rb.) sphaeroides. These early photosynthetic organisms are simple, one-cellular protein-bound donor–acceptor complexes that contain only one RC for light-induced charge-separation. They cannot split water, but rather use hydrogen sulfide or organic compounds as electron donors to reduce CO2 to carbohydrates with the help of sunlight and bacteriochlorophyll as biocatalyst.
In Fig. 10 the structural arrangement of the RC of Rb. sphaeroides is shown according to the 3 Å resolution X-ray structure.100–102 The cofactors are embedded in the L, M, H protein domains forming two ET branches, A and B. The RC of the carotinoid-less strain R26 of Rb. sphaeroides contains nine cofactors: the primary donor P865 “special pair” (a bacteriochlorophyll a (BChl) dimer), two accessory BChls (BA, BB), two bacteriopheophytins a (BPhe: HA, HB), two ubiquinones (QA, QB), one non-heme iron (Fe2+).
 | ||
| Fig. 10 X-ray structural model of the RC from Rb. sphaeroides100 with the protein subunits and the cofactors P865, B, H, Q and Fe. Light-induced electron transfer proceeds predominantly along the A branch of the cofactors (“unidirectionality” enigma) despite the approximate C2 symmetry of the cofactor arrangement. The ET time constants range from 2 ps to 100 μs in the cascade of transmembrane charge-separation steps. For details, see text. | ||
As a dominant motif in the evolution of photosynthetic bacteria, an approximate C2 symmetry prevails for the cofactor arrangement in the RC. It is intriguing that, despite the apparent two-fold local symmetry of the cofactor arrangement, the primary ET pathway is one-sided along the A branch, as indicated by the arrows in Fig. 10. The origin of this “unidirectionality” enigma of bacterial ET is not yet fully understood despite the numerous elaborate studies, both experimentally and theoretically, performed over the last 10 years. As a matter of fact, the high-resolution X-ray structure reveals that C2 symmetry does not hold for the protein environment of the cofactors, but is broken by different amino acids along the two ET branches. Thereby, the relative energetics and H-bond properties of the cofactors along the two branches will be different. They control the participation of cofactors as intermediate states in the ET cascade. From numerous genetic engineering experiments it turned out that such a “unidirectionality switch” in the RC system is very robust against point mutations of the amino acid environment of the cofactors.103 It was only recently demonstrated that specific double-site mutations in the vicinity of the primary donor and an accessory BChl can significantly change the partition of ET between the A and B branches.104,105 This is strong indication that in the wild-type system the breakage of symmetry in the ET pathways is largely due to the finely tuned energetics and electronic couplings of the primary donor and the intermediary acceptors.
For further reading about structure and spectroscopy of photosynthetic reaction centres, a large number of overviews is available, for example refs. 106–108.
To gain further insight into the origins and consequences of this asymmetry in the electronic structure, various site-directed mutants of the RC are being investigated in our laboratory by 360 GHz high-field EPR. In some of these mutants the ligands to the magnesium of the bacteriochlorophylls were altered. Fig. 11 shows the exchange of the histidine His(M202) by lencine(L) or glutamic acid(E) to generate the mutants HL(M202) and HE(M202), respectively. Since the characteristic optical absorption band of P˙+ in wild-type and R26 at λ = 865 nm is absent in these mutants,110,122,123 we will omit the index of P˙+ in the following. In the symmetry-related heterodimer mutants HL(M202) and HL(L173),116 the His that ligates the Mg in the BChl is exchanged for a Leu that does not ligate to the metal centre, resulting in a BChl:BPhe heterodimer.100 In HL(M202), the unpaired electron in P˙+ was shown to reside on the BChl(L),115,116 in HL(L173) on the BChl(M) dimer half.116 It was, however, also shown that in both mutants the main ET pathway is still provided by the A-branch.122 This finding emphasizes that the asymmetry in the electron spin density (and charge) distribution in P˙+ is not a priori the major contributor to the unidirectionality of the ET in bacterial RCs, but its effect is enhanced by specific cofactor–protein interactions apart from those affecting markedly the spin distribution.
 | ||
| Fig. 11 X-ray structure of the primary-donor special pair P865 and its immediate amino acid environment in RCs from Rb. sphaeroides.100 In the site-directed mutants HL (M202) and HE (M202) the histidine His M202 is replaced by a leucine Leu and by a glutamic acid Glu, respectively. | ||
The ENDOR/TRIPLE experiments provide hfc’s of the various magnetic nuclei in the P˙+ molecule which represent local probes of the electronic wavefunction. The assignment of the individual hfc’s to molecular positions is a difficult task. It involved selective isotope labelling and additional measurements on RC single crystals.29 A less time-consuming approach would be desirable to obtain information on the symmetry properties of the electronic structure. This is offered by g-tensor measurements. In contrast to the local hfc probes, the g-tensor represents a more global probe of the electronic wavefunction of the unpaired electron. For many organic biosystems the g-tensor anisotropies Δg are very small and cannot be resolved by standard EPR at 9.5 GHz (X-band) or 35 GHz (Q-band), because the Zeeman-field shifts of the g-tensor components are still smaller than the inhomogeneous linewidth. P˙+ in photosynthetic RCs exhibits extremely small g-tensor anisotropies of ∼10−3. It is, therefore, a prime example of a situation where even high-field EPR at 3.4 T/95 GHz (W-band) can only partially resolve the powder pattern of the isotropically disordered samples.67,113,124–126 To move these samples into the high-field regime already at W-band frequencies (see eqn. (5)), one has to reduce the linewidth by elaborate sample-preparation techniques like deuteration or single-crystal growing. In an attempt to determine, by means of the global g-tensor probe, the characteristic symmetry properties of the electronic structure of the primary donor, 95 GHz high-field EPR on illuminated single-crystal RCs of Rb. sphaeroides was performed at 12 °C, i.e., at physiological temperatures!67 The single-crystal EPR linewidth is so small that at a field of 3.3 T even the magnetically inequivalent sites in the unit cell of the RC crystal could be resolved. The rotation patterns of the RC single crystals, i.e., the angular dependence of their g-factors in the three symmetry planes of the crystal, have been measured and analyzed by applying eqn. (3). The remarkable result is that the principal directions of the g-tensor are tilted in the molecular axes system and, thereby, reveal a breaking of the local C2 symmetry of the electronic structure of P865˙+. This finding is consistent with the ENDOR/TRIPLE results for the hyperfine structure (see above).
The expected shifts of the g-tensor components upon mutation will be even smaller – in the order of 10−4 – as has been shown by previous W-band measurements on similar mutants.113,126 The further increase of EPR frequency and field by a factor of 4 to 360 GHz and 12.9 T, however, provides the spectral resolution necessary to both fully resolve all three principal g-tensor components of P˙+ randomly oriented in frozen solution127 and to measure their mutation-induced shifts114 with high precision.
Fig. 12 shows the 360 GHz EPR spectra of P˙+ of R26 in comparison with those of the HL(M202) and HE(M202) mutants. Minimum least-squares fits to a model spin Hamiltonian including only the Zeeman interaction of radicals with an isotropic orientation distribution are overlaid as dashed lines over the measured spectra. The g-values obtained from these fits114 are summarized in Table 1. They are in accord with previous measurements within error limits.67,113,124–128 In discussing differences of observables, such as Δg = (gxx − gzz), the error in the presented 360 GHz EPR measurements is only 2 × 10⁻⁵, and the small shifts in the order of 10−4, that are induced by the mutations of the protein environment of P˙+, can therefore be detected with high significance. A small g-strain induced increase of the intrinsic linewidth compared to W-band EPR measurements113 from 0.89(6) mT to 1.4(2) mT is noticed114 but, owing to the concurrent increase in spectral resolution by factor of 4, this does not pose any resolution problems for bacterial RCs.
 | ||
| Fig. 12 First-derivative 360 GHz cw EPR signal of P˙+ in RCs from Rb. sphaeroides mutants at 160 K. The most prominent shifts of the g-tensor components gxx and gzz due to the mutation at M202 are indicated with solid arrows. Minimum least squared fits for each spectrum are overlaid with orange dashed lines (see ref. 114). | ||
5.1.2 Results of g-tensor computations of P˙+
All previous experimental results on the M202 mutants from X-ray structural analyses,100,129,130 ENDOR/TRIPLE110 and optical and FT-IR measurements131 strongly indicate that the primary donors of both the HL(M202) and the HE(M202) mutants are heterodimers of bacteriochlorophyll a and bacteriopheophytin a, BChl : BPhe, in contrast to the homodimeric species (BChl)2 of wild-type and R26 RCs. Both EPR studies and energetic considerations then lead to the conclusion that this structural modification of the primary donor in its oxidized paramagnetic state is characterized by an almost complete localisation of the spin density on the BChl(L) half bound to the L protein subunit.110,116 From this it seems straightforward to expect a shift of the g-tensor components of the mutants towards those of an isolated BChl˙+ monomer, as was also concluded earlier from a comparison of HL(M202) with R26.113 The g-component shifts observed in our 360 GHz EPR experiments, however, are very surprising in this respect: While for P˙+ of HL(M202), as noted above, the overall g-tensor anisotropy Δg = (gxx − gzz) becomes smaller (more like that of the monomer), for HE(M202) Δg increases to a value considerably larger than that for R26 (see Table 1).
This unexpected behaviour of Δg strongly suggests a local structural change of BChl(L) as a consequence of the M202 ligand mutations. This conclusion is also supported by the observation of considerable rearrangements in the spin density distributions on BChl(L) in the two mutants. For example, previous ENDOR/TRIPLE studies110 yielded quite different ratios RL = a(121L)/a(21L) of the isotropic methyl proton hfc’s at positions 121 and 21 on BChl(L) (see Fig. 3):
| RL(HL(M202)) = 1.29; RL(R26) = 1.44; RL(HE(M202)) = 1.66. |
Earlier semiempirical MO studies132 and experimental ENDOR/TRIPLE results on P˙+ in RCs115,118,133 suggest that such a variation of RL might originate in different torsional angles θac(L) of the acetyl group at position 3 with respect to the plane of the adjacent aromatic ring A (see Fig. 3). Different values of θac(L) for R26, HL(M202) and HE(M202) are, in fact, expected since the acetyl-methyl groups point towards the region of the molecular centres of the dimeric counter parts. This is BChl(M) in the case of R26, and BPhe in the case of HL(M202) and HE(M202), where the changes in the chemical structures due to the mutations occur. Obviously, the experimental ratios RL, as given above, correlate with the corresponding values of Δg (see Table 1). This observation urged us to perform theoretical calculations of the g-tensors of the three P˙+ species as a function of θac(L). Since earlier semiempirical MO calculations based on AM1 or ZINDO/S wavefunctions74 failed to reveal any changes in Δg as a function of θac (but rather revealed changes in g-tensor axes orientation), we have applied more advanced relativistic DFT methods employing the ADF package,78 and the SZ-approach79 for the calculation of magnetic resonance parameters. Details of the employed packages can be found in our previous publication.114
The results are summarized in Table 2. The calculated values of RL show a marked monotonic increase with increasing values of θac(L). The calculated principal components gxx, gyy and gzz show only moderate quantitative agreement with the experimental values, something that is frequently observed for DFT-based calculations of g-tensor components.79,88,114,134 However, a correct qualitative prediction of trends of gii as a function of θac(L) should be provided by the present DFT results.
The essential conclusion from the current computational results is that our model predicts a range of increasing angles θac(L) between 0° and 30°–35° in which both RL and Δg increase parallel to each other, in accordance with our experimental results. The increase in Δg in this series is entirely due to a decrease of gzz. This is reasonable, since the rotation of the acetyl group perturbs the planarity of the electronic π-system and, therefore, primarily leads to changes in gzz. In the same angular region, the value of gyy − gzz also increases parallel to RL and Δg, in accordance with the experimental results (Table 1).
To model the remaining experimentally observed strong shift of the gxx component, one needs to take into account H-bonding interactions with the environment. An H-bond of the acetyl-group oxygen atom to the neighbouring histidine shifts gxx to larger values, and we conclude that the strength of this H-bond, i.e., the distance r(H⋯Oac), varies in the three mutant species according to r(HE) < r(R26) < r(HL). This conclusion cannot be tested directly by means of the X-ray structure because of the insufficient precision of atomic positions from X-ray crystallography. Further DFT calculations are in progress with the aim to gain a deeper insight into the general influence of polar side groups, superimposed electric fields and H-bond effects on g-tensor components in photosynthetic systems.
Also further 360 GHz EPR experiments with RC mutants, in which the H-bond network around the L-half of the special pair has been altered, are in preparation. The high sensitivity of very-high-field EPR to subtle changes in the structure and microenvironment of the ET chromophores should provide valuable insight into the influence of structural features and energetics on the effectiveness and directionality of the electron transfer steps.
It is well known that in photosynthetic RCs molecular dynamics of the cofactors and the protein matrix play an important role in the kinetics of the electron transfer.139,140 To investigate the molecular motion of the ubiquinone-10 (UQ10) cofactor anions, QA˙− and QB˙−, in RCs of Rb. sphaeroides R26, we performed high-field/high-frequency (3.4 T/95 GHz, W-band) two-pulse echo experiments. In the investigated RCs the paramagnetic Fe2+ was replaced by diamagnetic Zn2+ to reduce the linewidth of the EPR spectra.141 Thereby, the g-tensor anisotropy is left as the linewidth-determining relaxation contribution to the W-band spectrum. Because the g-tensor anisotropies of quinone radical anions are about 4 × 10⁻³ and the inhomogeneous linewidth is about 0.5 mT, W-band EPR is required to spread the spectrum sufficiently (over almost 10 mT) and to separate the x, y and z components of the g-tensor (see Fig. 13).124 Therefore, one can spectroscopically select those molecules in the sample that are oriented with one of these principal g-tensor axes along B0 to measure their phase-memory time Tmem.142Tmem is the time constant of the echo decay and, since this is monoexponential, Tmem can be identified as the transverse relaxation time T2. At high magnetic fields, the dominant anisotropic T2 relaxation is induced by molecular motion modulating the effective g-value of the tumbling radical. At W-band Zeeman fields this leads to orientation dependent modulation of the resonance condition. The anisotropic T2 contributions have minima (longest T2) along the canonical orientations of the g-tensor. Thus, the determination of T2 as a function of the resonance position in the high-field EPR spectrum provides information about the directions and amplitudes of molecular motions and their correlation times. An example is given in Fig. 13, which shows how the orientation dependence of T2 changes the lineshape of the echo-detected EPR spectrum of QB˙− in the RC of Rb. sphaeroides R26.143
 | ||
| Fig. 13 W-band echo-detected EPR spectra of QB˙− in RCs (Fe2+ substituted by Zn2+) from Rb. sphaeroides at 120 K. The spectra are measured with the pulse sequence shown below for different values of τ. For longer τ, the echo amplitudes decrease and the spectral shape changes because of the orientation dependence of the phase-memory time (see ref. 143). | ||
In Fig. 14, T2 of QA˙− and QB˙− is plotted vs. the magnetic field for different temperatures. The relaxation times of QA˙− and QB˙− at the resonance positions for gxx, gyy and gzz are clearly different, but their orientation dependence is strikingly similar: At 120 K, T2 reaches its maximum at the gxx position of the spectrum while the shortest relaxation times are found at the intermediate position between gyy and gzz. At the positions gyy and gzz, the T2 values are nearly the same and only slightly above the minimum value.
 | ||
| Fig. 14 Field dependence of T2 for QA˙− (upper panels) and QB˙− (lower panels) at various temperatures (see ref. 143). In the upper part of the panels, T2, as extracted from the echo decays by means of monoexponential functions, are presented. In the lower parts of the panels, the W-band echo-detected EPR spectra (τ = 100 ns) are shown as a function of B0. The absolute errors of the relaxation times differ at different spectral positions. The biggest errors (±100 ns) are found at the edges of the spectrum, while the smallest errors are observed at the maximum of the spectrum (±20 ns). | ||
From experiments on one quinone alone it is not possible to discriminate between fluctuations of the quinone in its binding pocket and fluctuations of the quinone’s protein microenvironment. However, this discrimination could be achieved by comparing the temperature dependence of the T2 anisotropy of the echo-detected spectra of both QA˙− and QB˙− (see Fig. 14): Despite their different binding pockets in terms of amino acid composition and spatial constraints (see Fig. 15), the observed field dependence of the relaxation times of QA˙− and QB˙− is very similar, and at 120 K exhibits a pronounced T2 maximum along the gxx axis. Such an anisotropic mode of the motion of the whole protein, which effects QA˙− and QB˙− in the same way, is highly improbable. Hence, we conclude that at 120 K the whole protein does not fluctuate on the EPR time scale, but the cofactors librate individually in random fashion around an H-bond axis in x direction.142,143
 | ||
| Fig. 15 Structure of the QA and QB˙− binding sites in the RC from Rb. sphaeroides as obtained from X-ray structure analysis on the charge separated state P˙+QB˙−.152 For clarity, the isoprenoid chains of the two ubiquinones are truncated. The orientation of the g-tensor axis system relative to the molecular frame of the ubiquinone is depicted in Fig. 4. X-ray and ENDOR studies deduced possible H-bonds to His(M219) and to Ala(M260) for QA˙− and to His(L190), Ser(L223), Gly(L225) and Ile(L224) for QB˙−.150 The angles which relate the g-tensors of QA˙− and QB˙− to each other in the state QA˙−QB˙− are obtained from cw-EPR measurements.214 Note that for EPR work the Fe2+ was replaced by Zn2+, the z direction of the g-tensor axis system is perpendicular to the quinone plane. | ||
The T2 values in the various directions mirror the local restrictions to the motion of the quinone in its binding environment. In their protein pockets both QA˙− and QB˙− fluctuate uniaxially at 120 K about a dominant binding axis, which lies along a strong H-bond to an amino acid of the protein pocket. For QA˙− and QB˙− the H-bond directions are approximately parallel to gxx, as is reflected by their similar relaxation pattern.
For QA˙−, this result can be understood from the X-ray structure of the RC in its ground state QA:144 The x-axis of the quinone, which is along the C![[double bond, length as m-dash]](https://www.rsc.org/images/entities/char_e001.gif) O bonds, points to the nearby histidine residue, His M219, and to the more distant alanine, Ala M260, allowing a strong and a weak H-bond to be formed between the imidazole and peptide nitrogens and the two respective carbonyl oxygens. This asymmetric H-bond pattern is obviously preserved in the anion state QA˙−, which is probed by EPR and is indistinguishable within the accuracy limits from that of the ground state QA. This conclusion is in accordance with the H-bond situation observed for 13C-labelled QA by NMR145,146 and FT-IR147 and for 13C-labelled QA˙− by X- and Q-band EPR.148–151 In other words: The QA binding site does not noticeably change its structure upon light-induced charge separation.
O bonds, points to the nearby histidine residue, His M219, and to the more distant alanine, Ala M260, allowing a strong and a weak H-bond to be formed between the imidazole and peptide nitrogens and the two respective carbonyl oxygens. This asymmetric H-bond pattern is obviously preserved in the anion state QA˙−, which is probed by EPR and is indistinguishable within the accuracy limits from that of the ground state QA. This conclusion is in accordance with the H-bond situation observed for 13C-labelled QA by NMR145,146 and FT-IR147 and for 13C-labelled QA˙− by X- and Q-band EPR.148–151 In other words: The QA binding site does not noticeably change its structure upon light-induced charge separation.
What about the QB binding site? In the ground-state X-ray structure144 the CO bonds of QB do not point to a nearby H-bonding amino acid candidate! Hence, our high-field spin-echo result, that also QB˙− undergoes uniaxial librational motion at 120 K around the quinone x-axis, can only be understood by assuming structural changes of the QB binding site upon charge separation, shifting an H-bond candidate like a histidine close to the CO bond. Such structural changes of the QB site have indeed been unveiled in a recent high-resolution (1.9 Å) X-ray crystallography experiment by Stowell et al.152 They claim to have detected dramatic displacements of QB˙− by almost 5 Å in the light-adapted X-ray structure in comparison to the dark-adapted one, i.e., the ground-state structure. This quinone movement brings the histidine, His L190, into the proximity of an carbonyl oxygen of QB˙−, thereby favouring the formation of an H-bond in x direction (see Fig. 15). The authors152 postulate that this structural change is a necessary prerequisite for electron transfer to proceed from QA˙−QB to QAQB˙−. Moreover, it offers an explanation of the observation by Kleinfeld et al.139 that at 90 K the ET from QA˙−QB to QAQB˙− is blocked in RCs frozen in the dark (ground state), but effective in RCs frozen under illumination (charge-separated state). In other words: The structural change of the QB site under illumination provides a molecular switch for vectorial ET steps in bacterial photosynthesis. The present results show that low-temperature high-field spin-echo measurements of the relaxation times at different spectral positions can be used to reveal important structural information such as H-bond directions in functional proteins at work.
When going to higher temperatures, the orientation dependence of the relaxation times of QA˙− and QB˙− changes (see Fig. 14). The differences in T2 values at canonical positions and intermediate positions increase, while the T2 values at the canonical positions become equal. At 180 K the echo signals at the intermediate positions relax approximately three times faster than at gxx, gyy and gzz. This shows that at temperatures higher than 150 K, the motional modes loose their directional preference. These changes in the relaxation anisotropy could be due to additional fluctuations between conformational substates of the protein that superimpose the fluctuations of the quinones around their H-bond axis. Such fluctuations are of great interest to be studied because they are generally considered to be mandatory for the electron transfer in photosynthesis.140 Work is in progress to determine the time scales and amplitudes of these cofactor motions by measuring the relaxation times at different external magnetic fields and microwave frequencies.
5.2 Bacteriorhodopsin (BR)
Apparently, Nature has invented photosynthesis, i.e., the strategy to use sunlight as energy source to synthesize ATP, twice: In the photosynthetic reaction centre (RC) protein complex of purple bacteria this is initiated by light-induced primary electron transfer between bacteriochlorophyll and quinone cofactors, mediated by the protein microenvironment. In the bacteriorhodopsin (BR) protein complex this is set going by light-initiated primary proton transfer between amino acid residues, mediated by conformational changes of the only cofactor, the retinal.
BR is a 26 kDa protein complex located in the cell membrane of halophilic archae-bacteria such as Halobacterium salinarium. High-resolution (1.6 Å) X-ray crystallography coordinates are available for the ground-state structure153 (see Figs. 16 and 20). Seven transmembrane helices (A-G) enclose the chromophore retinal which is covalently attached to the amino acid lysine, K216, on helix G via a protonated Schiff base. Absorption of 570 nm photons initiates the all-trans to 13-cis photoisomerization of the retinal. The Schiff base then releases a proton to the extracellular medium and is subsequently reprotonated from the cytoplasm. Transient intermediates of this catalytic photocycle can be distinguished by the different absorption properties of the retinal, and a sequence of intermediates (J, K, L, M, N and O) has been characterized by time-resolved absorption spectroscopy.154 Double-flash experiments revealed that the M intermediate is divided into two substates, M1 and M2155,156 During this photocycle conformational changes of the protein (and the retinal) occur, as has been detected by a variety of experimental techniques (for a review see, e.g., ref. 157). The physiological role of such changes is discussed to ensure that release and uptake of protons do not occur from the same side of the membrane, but rather enable BR to work as a vectorial transmembrane proton pump. To this end, in wild-type BR conformational changes associated with the M1 to M2 transition are suggested to function as a “reprotonation switch” required for the vectorial proton transport. Hence, it is believed that during the lifetime of the M state the accessibility of the Schiff base for protons is switched from the extracellular to the cytoplasmic side of the membrane. Detailed analyses of the nature of the conformational changes, for example by neutron diffraction,158,159 electron microscopy,160–163 X-ray diffraction,164,165 solid-state NMR166,167 or EPR spectroscopy,168–173 agree in the major changes to be localized at the cytoplasmic moieties of helices F and G. These helix movements in wild-type BR, which can be observed to be present already in the M intermediates with the Schiff base deprotonated, have been shown to result in an “opening” of the protein to protons on the cytoplasmic end of the transmembrane proton channel161 and, thus, should allow proton transfer to occur from the internal aspartic-acid proton donor, D96, to the Schiff base during the M to N transition. The reprotonation of D96 from the cytoplasm occurs during the recovery of the BR initial state. A detailed inspection of the structure of the unilluminated state of the protein reveals that certain amino acid side chains block the proton pathway from the cytoplasm to D96.161 The region between D96 and the Schiff base is largely nonpolar, packed with bulky amino acid residues. Hence, in this unilluminated state the Schiff base is effectively inaccessible to protons from the cytoplasm. In the light-driven M1 to M2 transition, this region is opened for access of protons to the Schiff-base nitrogen atom. However, the question remains, and is in fact still hotly debated,161,174 whether the large conformational changes observed in the photocycle of the wild-type and many BR mutants are a prerequisite for vectorial proton transport, i.e., really represent the proposed reprotonation switch.
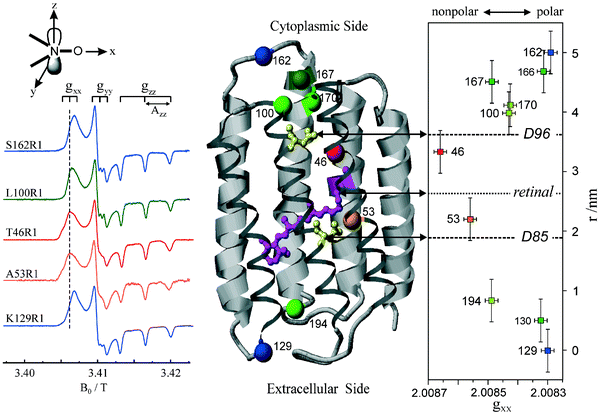 | ||
| Fig. 16 Left: Experimental W-band cw EPR spectra for a set of BR mutants spin labelled with the nitroxide side-chain (R1). Middle: Structural model of BR. The Cα atom of the spin-labelled residues, the chromophore retinal, and D96 and D85 participating in the H+ transfer are indicated. Right: The magnitude of tensor element gxx of the spin labels as function of the nitroxide location in the protein with respect to position 129. | ||
This on-going discussion got strong momentum in favour of an alternative, or additional, conformational change mechanism, involving reduction of the retinal curvature that emerged from the results of recent FT-IR studies of the BR triple mutant D96G/F171C/F219L.174 This functionally intact BR triple mutant has been shown to provide already in the dark the full extent of the light-driven conformational changes of the protein helices at the cytoplasmic entrance of the putative proton channel.161,162 In other words: In the triple mutant the wild-type structure around the cytoplasmic proton channel is altered to such an extent that a pseudo M2 state is generated with the helix conformation of the late M intermediate, but which is stable in the dark. Surprisingly, FT-IR spectroscopy monitoring the helix movements during proton transfer in comparison with those of wild-type BR, revealed that efficient vectorial proton translocation in the photocycle of the BR triple mutant occurs in the absence of substantial conformation changes of the protein.174 These results indicate that the reprotonation switch operates even without large protein conformational changes, but rather involves retinal unbending. However, despite this evidence in disfavour of large protein rearrangement for the switch mechanism, it is likely that the last word has not been spoken on the subject. For example, on the biological function of the large conformational changes of protein helices that occur during the photocycle of wild-type BR. Obviously, additional spectroscopic experiments are needed on wild-type and strategically constructed BR mutants. They should distinguish themselves by sufficient sensitivity and resolution to follow also small conformational changes of protein and cofactor during the photocycle. In this respect, good news appears to be on the horizon with the combination of site-directed mutagenesis for spin labelling and high-field EPR for resolving structural changes of proteins at work.
For further reading about structure and spectroscopy of bacteriorhodopsin, a large number of overviews is available, for example.157,175
 | ||
| Fig. 17 First-derivative cw EPR spectra of a nitroxide radical (OH-TEMPO) in frozen water solution at different microwave frequency/B0 settings.72 The spectra are plotted relative to the fixed gzz value. | ||
For measuring the polarity changes, W-band EPR spectra were recorded at temperatures below 200 K to avoid motional averaging of the anisotropic magnetic tensors. At these temperatures, R1 can be considered as immobilized on the EPR time scale. The spectra of selected mutants are shown in Fig. 16. They exhibit the typical nitroxide powder-pattern lineshape expected for an isotropic distribution of diluted radicals. The spectra are clearly resolved into three separate regions corresponding to the components gxx, gyy and gzz, the latter with resolved Azz splitting. The variations of gxx and Azz with the nitroxide binding site can be measured with high precision. The plots of gxx and Azzvs. R1 position r along the proton channel (Fig. 16 shows only the gxxvs.r plot) demonstrate distinct variations in the polarity and proticity of the nitroxide microenvironment. According to the structure model,179 residue S162R1 is located in the E–F loop at the cytoplasmic surface, whereas residue K129R1 is positioned in the D–E loop on the extracellular surface. The high polarity in the environment of these residues is clear evidence that the nitroxides are accessible to water, which is in agreement with the structure. The environmental polarity of the nitroxide at positions 100, 167 and 170 is significantly smaller and reaches its minimum at position 46 between the proton donor D96 and the retinal. The plots directly reflect the hydrophobic barrier that the proton has to overcome on its way though the protein channel.
The analysis of both tensor components, gxx and Azz, allows to characterize the R1 environment in terms of protic and aprotic surroundings. Theoretically, both gxx and Azz are expected to be linearly dependent on the π-spin density ρO at the oxygen atom of the nitroxide group (see below). For gxx, however, apart from a direct proportionality to ρO, there is an additional dependence on specific properties of the oxygen lone-pair orbitals. The lone-pair orbital energy En affects gxxvia the excitation energy ΔEnπ* = Eπ* − En and is known to be sensitive to the polarity of the environment. It is particularly sensitive to H-bonding of the lone pairs to water or to polar amino acid residues. Thus, the plot of gxxvs.Azz should indicate the presence or absence of H-bonds in the spin-label environment, i.e., its proticity (see below). This dependence is plotted in Fig. 18 for various spin-label positions in BR.173 Obviously, two straight-line correlations can be deduced. The points corresponding to positions 46, 171 and 167 belong to a line whose slope is different from that for the remaining points. These three positions can be classified to be exposed to an aprotic environment,180,181 the other ones to a protic environment. This allows to characterize the hydrophobic barrier of the BR proton channel in terms of different accessibilities of the respective protein regions to water molecules.
 | ||
| Fig. 18 Plot of gxxvs.Azz of the nitroxide side-chains for various spin-label positions in BR (see text). The “protic” and “aprotic” limiting cases are placed with reference to theory, see ref. 178 and Fig. 19. | ||
A theoretical interpretation of the observed gxxvs.Azz dependence in site-directed nitroxide spin labelled BR was attempted on the basis of semiempirical MO theory and by using simple models for varying solute–solvent interactions.178 The ultimate goal was to extract a measure for the different magnitudes of polar and protic contributions from the spin-label environment to gxx and Azz and to find a way to discriminate between these two effects. The calculation of the g-tensor components gii, i = x, y, z, is based on the MO treatment of Stone75,182 for organic radicals. The evaluation of the resulting formulae requires the input of the ground and excited states molecular wavefunctions in their linear-combination-of-atomic-orbitals (LCAO) representation, and their respective state energies in addition to the spin–orbit coupling parameters of the various contributing atoms. All the required MO quantities were computed at the ZINDO/S183 level from restricted Hartree–Fock (RHF) ground state MOs. The required spin–orbit coupling parameters were taken from the literature.184 The variations of gxx due to solute–solvent interactions can be understood qualitatively by analyzing the dominant constituents of this component according to the theory of Stone. These are approximately given by
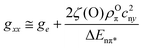 | (8) |
Solute–solvent interactions can affect on all three quantities ρOπ, c2ny and Enπ*, on the first two of these by electron density rearrangements and on the latter by energy level shifts either by superimposed electric fields or by H-bond formation. Thus, any change in gxx can be broken down into three contributions:
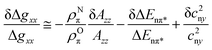 | (9) |
| Azz = QNπρNπ | (10) |
| δρNπ = C1Ex | (11) |
The effects of H-bonding (hb) on the gxxvs.Azz dependence have been studied theoretically on an nitroxide model structure with one water H-bonded to the O atom. The same approach was taken by Un et al.185 in a theoretical study on tyrosyl radicals. Fig. 19 shows the calculated gxxvs.Azz dependence for an nitroxide spin-label model structure.178 The upper dashed line, defined as “aprotic”, is based on the calculated gxx values without hb formation, the lower dashed line with hb formation. This latter line is shifted against the aprotic line by a constant value of −4 × 10⁻⁴ over the whole range of Ex values between 0 and 0.02 au (1 au = 5 × 10⁹ V cm−1). The solid line, defined as “protic” in analogy with the definition by Kawamura et al.180 was derived by connecting the points A and B, characterized by the non-polar/aprotic limit with the experimental value Azz = 3.36 mT, and by the highly polar/protic situation in water where Azz = 3.64 mT, respectively.
 | ||
| Fig. 19 Plot of gxxvs.Azz for a planar nitroxide model radical as calculated for the aprotic case (without hydrogen bonding, short dashes) and with hydrogen bonding (long dashes). The “protic” line (solid line) is obtained by linear interpolation between the non-polar limit (point A, Azz = 3.36 mT) and the water limit (point B, Azz = 3.64 mT), see text. All plotted curves have been linearized over the given range of Azz. For details, see ref. 178. | ||
Any point between the two limiting lines with and without H-bonding can be assigned a fractional H-bonding parameter qprot between 0 (point A) and 100% (point B) to serve as a measure of the protic interaction (proticity). In terms of the gxx values at a particular polarity Ex (i.e., for Azz = const.) we thus define
 | (12) |
The calculated average slope |dgxx/dEx| ≅ 1.5 × 10⁻¹¹ cm V−1 is close to the corresponding experimental value (2.0 ± 0.3) × 10−11 cm V−1 found by Gullá et al.186 The latter value was also ascertained theoretically in the same laboratory by a subsequent ab initio calculation187 on the structurally similar nitroxide radical 2,2,5,5-tetramethyl 3,4-dehydropyrrolidine-1-oxyl (TMDP).
Fig. 18 shows that the majority of the spin-label sites in BR are grouped closely around the protic line, thus demonstrating the close correlation between proticity and polarity in the protein. The measured values of gxx and Azz of the currently discussed triple mutant D96G/F171R1/F219L yield qprot ≅ 18% and thus disclose an almost non-polar and aprotic environment (see below).
 | ||
| Fig. 20 Side (A) and top (B) views of the X-ray structural model of bacteriorhodopsin (BR).161 The seven α-helices (A–G) and the interconnecting loops are visible, the Cα atoms of the spin-labelled residues are indicated as spheres. Part C shows a detailed view of helices E and F with position 171 indicated. Here, we present an overlay of the wild type structure (PDB-code 1FBB, blue) with the open structure (PDB-code 1FBK, red) of the pseudo M-state found for the unilluminated triple mutant D96G/F171C/F219L. The outward movement of position 171 in the pseudo M-intermediate becomes clearly visible. For details, see ref. 172. | ||
 | ||
| Fig. 21 Polarity plot of gxxvs.Azz of the nitroxide side-chains R1 for various spin-label positions in BR mutants with emphasis on R1 position 171 in the single mutant F171R1 (square), the double mutant D96G/F171R1 (triangle) and the triple mutant D96G/F171R1/F219L (circle). The dark state of the triple mutant reveals a very nonpolar protein microenvironment of R1 in the vicinity of the cytoplasmic entrance of the proton channel. Light excitation of the single mutant switches the microenvironment of R1 to the same nonpolar properties as experienced by the triple mutant in the dark. For details, see refs. 172 and 174. | ||
Pronounced conformational changes of wild-type BR during the photocycle were also observed in the high-field EPR spectra of selectively spin-labelled double mutants V167R1/D96N and V101R1/D96N in their ground states recorded in the dark, and under light illumination. The missing proton donor D96 in these double mutants (owing to the D96N replacement) leads to a prolonged photocycle which facilitates photoaccumulation of the M intermediate. Spin-label position 167 is located on the E–F loop and spin-label position 101 on the C–D loop thereby probing the spatial configuration of these loops when the connected helices move under illumination.
The dark-minus-light spectra clearly show an increased reorientation mobility of the nitroxide side-chain R1 in the M intermediate of the V161R1/D96N mutant, but a decreased mobility for V101R1/D96N. This is revealed by the different degree of averaging of the nitrogen hyperfine splitting and by shifts towards the centre line. Obviously, the residual anisotropy of the nitroxide motion changes during the photocycle owing to changing space restrictions within the binding site. Label V167R1 is located at the cytoplasmatic moiety of helix F and oriented towards helix C. Thus, an increase of the interhelical distance, caused by motion of helix F or helix C, would account for the experimental data: in accordance with neutron-diffraction and FT-IR results (for details see ref. 173).
5.3 Colicin A bacterial toxin
Colicin A is a member of a family of bacterial toxins that form transmembrane ion channels. Seven members of the colicin family are currently identified and sequenced, denoted E1, A, B, K, N, Ia, Ib.188–190 They are water-soluble proteins, mostly about 70 kDa in size, and have varying homology among themselves. Colicin A kills unprotected cells of attacked organisms by inserting specific portions of protein sub-domains into the cytoplasmic membrane forming a voltage-gated ion channel. The open channel leads to electrical depolarization of the membrane and depletion of intracellular ion pools, which ultimately leads to cell death. The mechanisms of protein entry into membranes and transmembrane channel formation are fundamental aspects of membrane biology and toxicology. To understand these mechanisms on the molecular level is currently also of biomedical interest, since insertion of proteins into membranes and subsequent channel formation are common to many toxic proteins of bacterial pathogens found in organisms ranging from bacteria to humans, such as the diphtheria, tetanus and cholera toxins.189–193
The colicin toxins have to overcome the protecting barriers of the attacked cell and, hence, the mechanisms of cell killing involve three distinct functional steps:188,194 (i) binding of the toxic protein to a receptor at the surface of the outer membrane, (ii) translocation across the outer membrane and periplasm and (iii) insertion of specific helical segments of the toxin sub-domain into the cytoplasmic membrane to form the ion-conducting channel. Accordingly, Colicin A consists of three functional protein domains: (i) the central receptor domain, R; (ii) the N-terminal translocation domain, T, to penetrate the outer membrane (aided by receptor proteins of the target cell) and to traverse the periplasm (aided by several membrane translocation proteins of the target); and (iii) the C-terminal channel-forming domain, C, to penetrate the inner membrane which protects the cytoplasm of the cell.190,195 These distinct functions of the colicins are reflected by their three-dimensional shape. The X-ray crystallographic structure of a complete (T–R–C) Colicin Ia protein was recently determined to 3.0 Å resolution,196 now refined to 2.3 Å,190 and reveals a harpoon-shaped molecule, 210 Å long, with the three functional domains well separated from each other thereby overcoming the protection barriers of the attacked cell.
The isolated C-domain retains its channel-forming ability in aqueous solutions of artificial membranes,197,198 such as lipid vesicles. Hence, details of refolding processes of the C-domain can be studied by in vitro experiments (see below). The X-ray crystal structure of the 204-residue (21 kD) channel-forming C-domain of Colicin A in its water-soluble conformation is available to 2.4 Å resolution199 (see Fig. 22). Ten α-helices, eight amphiphilic, two hydrophobic, are arranged in such a way that the amphiphilic helices surround the hydrophobic hairpin (helices 8 and 9) deeply buried in the centre of the protein. Thereby the 8,9-hairpin is shielded from contact with the water solvent.
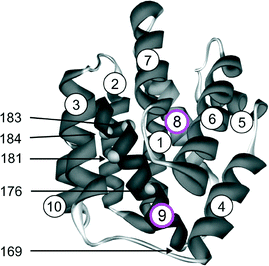 | ||
| Fig. 22 X-ray structure of the channel-forming C-domain of Colicin A. The positions of cysteine replacements in helix 9 by site-directed exchange mutagenesis are indicated by numbered spheres (169, 176, 181, 183, 184). The α-helices are labelled 1 (N-terminus) to 10 (C-terminus). The hydrophobic helices are 8 and 9. For details, see refs. 199, 203 and 206. | ||
In view of the difficulties encountered with determining X-ray structures of transient protein states in action, numerous spectroscopic techniques are being used to study colicins on the molecular level. Despite many years of work on colicins by solid-state NMR,200,201 FT-IR,202 FRET203 and EPR194,204,205 the details of the refolding processes upon membrane association and channel formation are not yet known. Since Colicin A is now so well characterized, it may serve as a paradigm to answer an intriguing question of general interest in molecular biology and medicine: What is the mechanism to switch on the insertion of water-soluble pore-forming proteins into the nonpolar lipid environment of a membrane?
 | ||
| Fig. 23 The “umbrella” model199 and the “penknife” model203 of the membrane-associated state of the channel-forming C-domain of Colicin A. | ||
For further reading about the biological background, structure and spectroscopy of colicin toxins, several overviews are available, for example see refs. 190 and 193.
In Fig. 22, the five individual amino acid residues of helix 9 of the C-domain are indicated by numbered spheres, which have been replaced by cysteines via exchange mutagenesis.203,206 We started our collaborative colicin studies with these five Colicin A mutants, each of which was generated by exchange of a native amino acid in the hydrophobic helix 9 by a cysteine at residue positions 169, 176, 181, 183 and 184, respectively. The single cysteines were spin labelled with the nitroxide label MTS providing a nitroxide side chain R1.63 Our experimental strategy for detecting the refolding of the C-domain under membrane association was to compare the EPR spectra of Colicin A in buffered aqueous solution under physiological conditions (pH 8) with those after adding lipids to the sample to form vesicles as artificial membranes.63 To this end, small unilamellar vesicles were generated by sonification of DMPG (1,2-dimyristoyl sn-glycero-3-phospho-rac-(1-glycerol)) in water.
To learn about the membrane-insertion mechanism leading either to a transmembrane configuration (as predicted by the umbrella model) or to a configuration with the hydrophobic helix 9 staying close to the water/membrane interface (as predicted by the penknife model), the 14N hyperfine-tensor components Azz and the gxx tensor components were measured for the five mutants. Both tensor components have proven to be sensitive probes of the polarity profile of the nitroxide microenvironment along a helix structure.172,173,178Fig. 24 shows, as a representative example, W-band spectra with and without lipid admixture of the Colicin A mutant G176C. The spectra clearly reveal shifts of the gxx and Azz tensor components at the low-field and high-field regions, respectively. The S/N ratio is good enough to extract reliable shift values of the tensor components upon lipid addition.
 | ||
| Fig. 24 W-band EPR spectra of the Colicin A mutant G176C with the nitroxide spin-label at position 176. The aqueous-solution and membrane-associated (with lipid) states show different gxx and Azz values. Artificial membranes are formed by adding an aqueous suspension (pH 8) of DMPG phospholipid vesicles (25 mg ml−1). For details, see ref. 63. | ||
In the water-soluble conformation (no lipid added) the Azz and gxx values reveal high polarity at both ends of helix 9 (positions 184, 169), and a lower polarity in the centre (position 176). This finding is consistent with the X-ray crystal structure.199 After addition of lipid a rather uniform, high-polarity character of the nitroxide microenvironment of all mutants results. The highest polarity change is experienced by the nitroxide side chain attached to position 176 in the central part of the helix. In comparison, the respective Azz and gxx data, determined for spin-label side chains attached to the outer surface of helix F of the transmembrane BR protein, shows a hydrophobic barrier173 (see section 5.2.2). Such a hydrophobic barrier does not exist for the membrane-associated configuration of helix 9 of Colicin A, i.e., this helix does not span the membrane. Moreover, the changes of Azz and gxx upon addition of lipid reveal that all segments of helix 9 penetrate less than 1.0 nm into the artificial membrane.
In Fig. 25 the W-band measurements of gxx and Azz are summarized. Both probes show that the central-region position 176 experiences a strong change in polarity of the microenvironment towards more polar character, whereas in the vicinity of the end-region positions 169, 184 only weak polarity changes occur upon adding lipids. This different behaviour of polarity changes upon membrane association for position 176 and positions 169, 184 is especially evident from this plot gxxvs.Azz (see Fig. 25), since such a representation is particularly informative with respect to local electric-field and H-bonding effects of the microenvironments of the nitroxide labels.173 As is shown in Fig. 25, addition of DMPG lipid results in a dramatic change of the microenvironment polarity in the vicinity of position 176 towards an increased polarity.
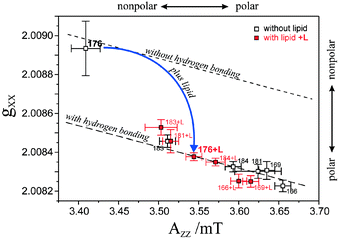 | ||
| Fig. 25 Polarity plot of gxxvs.Azz for the various nitroxide spin-label positions in helix 9 of site-directed Colicin A mutants. The measured tensor components with addition of lipid vesicles and without lipid addition are marked by full and open squares, respectively. The dashed lines define the limits between the non-hydrogen bonded (short dashes) and the fully hydrogen bonded (long dashes) cases, Fig. 19. For details, see refs. 63, 173 and 178. | ||
How can the W-band EPR results be rationalized in terms of the validity of either the umbrella or the penknife model of the membrane-associated configuration of the channel-forming C-domain? In the case where the umbrella model is valid, helices 8 and 9 should penetrate the membrane spontaneously so that their central part, as probed by the nitroxide side chain 176 in helix 9, would be placed into the membrane’s interior, i.e., in a highly nonpolar region. This means that in the umbrella model one would expect for spin label 176 no large changes of gxx and Azz upon adding lipid to the aqueous sample because in both states, water-soluble and membrane-associated, the microenvironment would remain nonpolar. In case the penknife model is valid, however, helix 9 should remain for some time in a transient state close to the membrane surface, until an electric potential change ΔΨ initiates helix insertion and pore formation in the membrane. In this situation, position 176 would experience a drastic change of the microenvironment from nonpolar to polar in the membrane-associated state.
This is exactly what we observe via the polarity probes gxx and Azz when adding vesicle-forming lipids to the aqueous sample. Hence, our data are not consistent with the umbrella model, but validate the penknife model for membrane association of the Colicin A channel-forming domain. This conclusion is in agreement with FRET experiments on Colicin A double mutants with site-specifically attached fluorescence labels203 (for more details, see ref. 63).
6. Conclusions and outlook
In this overview it is shown that modern multifrequency EPR spectroscopy at high magnetic fields provides detailed information about structure and dynamics of transient radicals and radical pairs occurring in biological electron and ion transfer processes. Thereby our understanding of the relation between structure, dynamics and function of molecular switches is considerably improved. This holds with respect to the fine-tuning of electronic properties of donor and acceptor cofactors by means of weak interactions with their protein and lipid environment, such as H-bonding to specific amino acid residues. This also holds with respect to the massive protein refolding in the course of transmembrane ion-channel formation.
We have restricted our overview to work performed in the high-field EPR laboratory at FU Berlin rather than providing an exhaustive review on advanced EPR in biophysical/biochemical research. Nevertheless, we claim that our conclusions are equally based on the work of our esteemed colleagues in the field. An excursion through biological magnetic resonance literature reveals a strong increase of high-field EPR applications with exciting news on nm and sub-nm structures of proteins and on the dynamics of their transient states while in biological action. These applications give new insights complementary to the results of other spectroscopic techniques, and some of them provide even unique information inaccessible by other “classical” spectroscopic techniques. This applies, for example, to large biosystems that lack long-range order, such as glasses and frozen solutions, for which distances and orientations of protein fragments and domains can be measured over a broad distance range, say 0.3 nm < r < 6 nm, even in time-resolved mode for short-lived intermediates in enzymatic reaction cycles. The limitations in high-field EPR instrumentation capabilities for short life times or relaxation times that existed until recently are currently being remedied.14,63,70,73 This refers to fast-flow probeheads for chemically instable transient70 or to sufficient output power of mm and sub-mm microwave sources for fast manipulation of the electron spins by short mw pulses.14,73 Consequently, wide avenues are being opened for fascinating new applications.
Below, some summarizing conclusions are given, relevant to biological systems in general:
1. Many organic cofactors in transfer proteins have only small g-anisotropies and, therefore, require much higher magnetic fields than available in X-band EPR to resolve the canonical g-tensor orientations in their powder spectra. Thereby, even on disordered samples, orientation-selective hydrogen bonding and polar interactions in the protein binding sites can be traced. This is important information complementary to what is available from high-resolution X-ray diffraction of protein single crystals.
2. In electron-transfer processes often several organic radical species are generated as transient intermediates. To distinguish them by the small differences in their g-factor and hyperfine interactions, high Zeeman fields are required and, hence, high-frequency EPR becomes the method of choice.
3. Often high-purity protein samples can be prepared only in minute quantities, for example of site-directed mutants or isotopically labelled cofactors. The problem of small concentration of paramagnetic states is even more dramatic for protein single crystals. Accordingly, to study them by EPR or ENDOR very high detection sensitivity is needed, which often can be accomplished only by dedicated high-field/high-frequency spectrometers. Optimum concentration sensitivity appears to be attainable in the W-band region, but at much higher mw frequencies a compromize has to be made between gain in resolution and loss of sensitivity which, for technical reasons, turns out to be unavoidable.
4. High-field/high-frequency cw EPR generally provides, by lineshape analysis, shorter time windows down into the ps range for studying correlation times and fluctuating local fields over a wide temperature range. They are associated with characteristic dynamic processes, such as protein, cofactor or lipid motion and protein folding.
5. Pulsed high-field/high-frequency EPR as, for example, two-dimensional field-swept electron spin-echo spectroscopy, provides real-time access to specific cofactor and/or protein motions in the ns time-scale. Motional anisotropy can be resolved which is governed by anisotropic interactions, such as hydrogen bonding along specific molecular axes within the binding site.
6. ENDOR at high Zeeman fields takes additional advantage of the orientation selection of molecular sub-ensembles in powder or frozen-solution samples. Thereby, even in the case of small g-anisotropies, ENDOR can provide single-crystal like information about hyperfine interactions, including anisotropic hydrogen bonding to the protein.
7. In metalloprotein high-spin systems, such as the Mn2+ proteins, the EPR spectrum analysis can be drastically simplified at high Zeeman fields due to the suppression of second-order effects. In case of large zero-field splittings, EPR transitions might not be observable at all at X-band, but become accessible at higher quantum energies of mm or sub-mm microwaves.
8. High-field EPR adds substantially to the capability of “classical” spectroscopic and diffraction techniques for determining structure-dynamics-function relations of biosystems, since transient intermediates can be observed in real time in their working states at biologically relevant time scales.
9. High-field EPR noticeably extends the applicability of the site-directed spin-labelling technique in bioengineering. Owing to the resolution of both the hyperfine- and g-tensor components of nitroxide spin probes, changes in the protein microenvironment, including conformational changes, can be identified as potential molecular switches for vectorial transmembrane transport processes in proteins at work. In this respect, the recent progress made in the quantum theoretical interpretation of the EPR observables, in particular of the g-tensor, has to be recognized.86–88
10. Most exciting developments in the theory and computation of magnetic resonance parameters of large biosystems are envisaged for the near future. High-field EPR instrumentation development will remain a challenging task for experimental physicists. Their exertion in measuring molecular parameters with high precision has cross-fertilized the efforts of theoreticians to interpret the experimental data in terms of molecular structure and dynamics, and vice versa. Cross-fertilization of ideas becomes also apparent in the efforts of molecular biochemists to construct point mutants with site-specifically altered properties. Such mutants are often strategically designed for elucidating the structure and dynamics of biosystems by EPR techniques.
On the horizon, non-evolutionary optimized protein chemistry appears feasible following reaction pathways that have been explored by advanced spectroscopic techniques. Such an approach will provide not only deeper insight into biological processes of utmost importance on Earth, such as photosynthesis, but will provide also new ideas how to take technical advantage of strategies developed by Nature. As a promising and appealing example the world-wide activities are mentioned to synthesize biomimetic model complexes for efficient photoinduced charge separation in analogy to evolutionary optimized primary photosynthesis. Interdisciplinary research on artificial photosynthesis will certainly continue to open new avenues of enquiry. Remarkable progress with biomimetic donor–acceptor complexes has been achieved during the last decade,207–212 and the high spirits of photovoltaic research based on organic compounds is obvious from glancing through specialist and general journals. Most striking in this respect is the recent report on successful integration of photosynthetic reaction-centre proteins in solid-state photovoltaic cells with high quantum yield and conversion efficiency.213
Imagine there is a breakthrough in realizing biomimetic photovoltaic cells with a capacity high enough to be attractive for practical applications. Multifrequency high-field EPR might have had a significant impact to make this dream come true. Advanced EPR techniques are principally able to provide the essential ingredients of structure-function relations for the electron-transfer intermediates of the photocycle. However, continuation of concerted efforts of biologists, chemists and physicists will be needed to achieve this goal. Fortunately, the high-field EPR community has an excellent record in interdisciplinary research. Expertise and instrumental capabilities of individual groups are often shared in cooperative projects to push molecular spectroscopy to new frontiers in biology, chemistry and physics. Besides photosynthetic reaction centres also the other two examples discussed in this review, the site-specifically spin-labelled bacteriorhodopsin proton pump and the colicin ion-channel forming toxin, should give a flavour of the potentiality of high-field EPR in characterizing the key factors that control vectorial transfer processes in proteins. Understanding those factors will enable the molecular engineering community to modulate such transfer processes by point mutations at will. Bright prospects for the future of advanced EPR spectroscopy, 60 years after Zavoisky’s discovery of the electron paramagnetic resonance phenomenon!
Acknowledgements
Over the years, numerous coworkers—students, postdocs, colleagues—from different parts of the world have contributed to our interdisciplinary high-field EPR work. We have greatly benefited from these collaborations and discussions, which were sometimes controversial, but were always stimulating. To all these coworkers we want to express our gratitude and appreciation. The expensive instrumental developments and spectroscopic research activities in our laboratory have enjoyed generous financial support by the Volkswagen-Foundation and the Deutsche Forschungsgemeinschaft (in recent years in particular by the DFG priority program SPP 1051 and the DFG collaborative research center SFB 498), which is gratefully acknowledged.References

扫一扫
关注我们
